Volume Master
Is this candle actually busy, or is it just the market open? Volume Master draws volume as a mirrored sound wave and compares every candle against what is usual for its own time of day, highlighting 20-session loud candles, gold wake-ups and forming-candle pace.
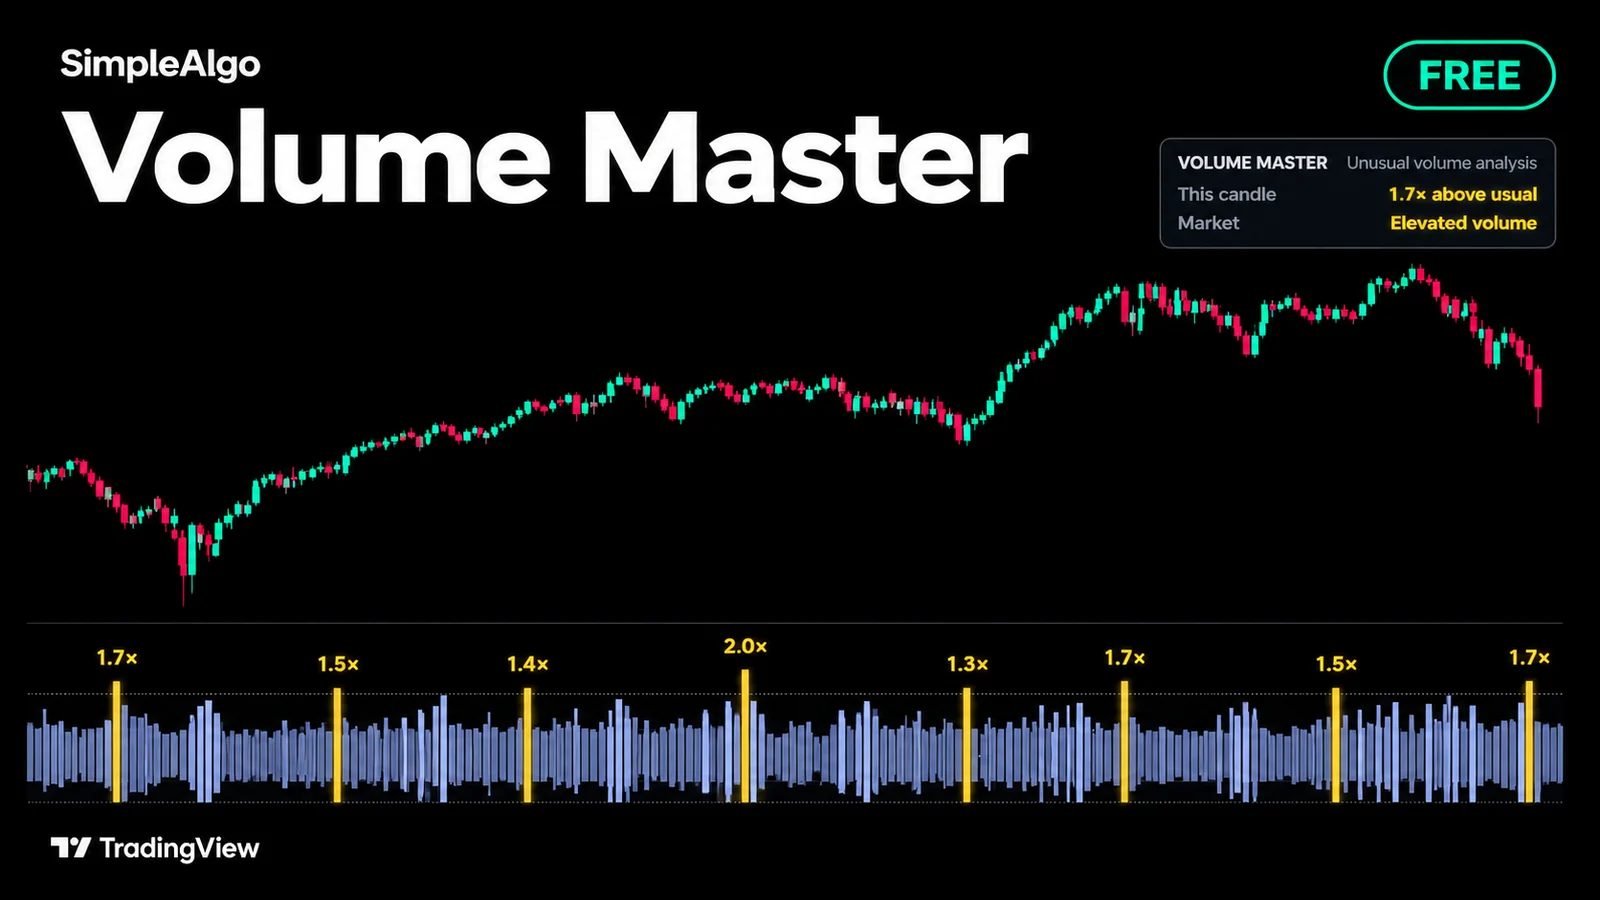
Getting started
- 1Open TradingView and click IndicatorsSearch for "Volume Master SimpleAlgo" in the Community scripts tab.
- 2Add Volume Master to your chart
- 3Keep the defaultsKeep Sessions to learn from at 20. Volume Master opens in its own pane below price while optionally shading candles and showing the corner panel on the price chart.
- 4Add alerts if you want themSet them to "Once per bar close".
What you see
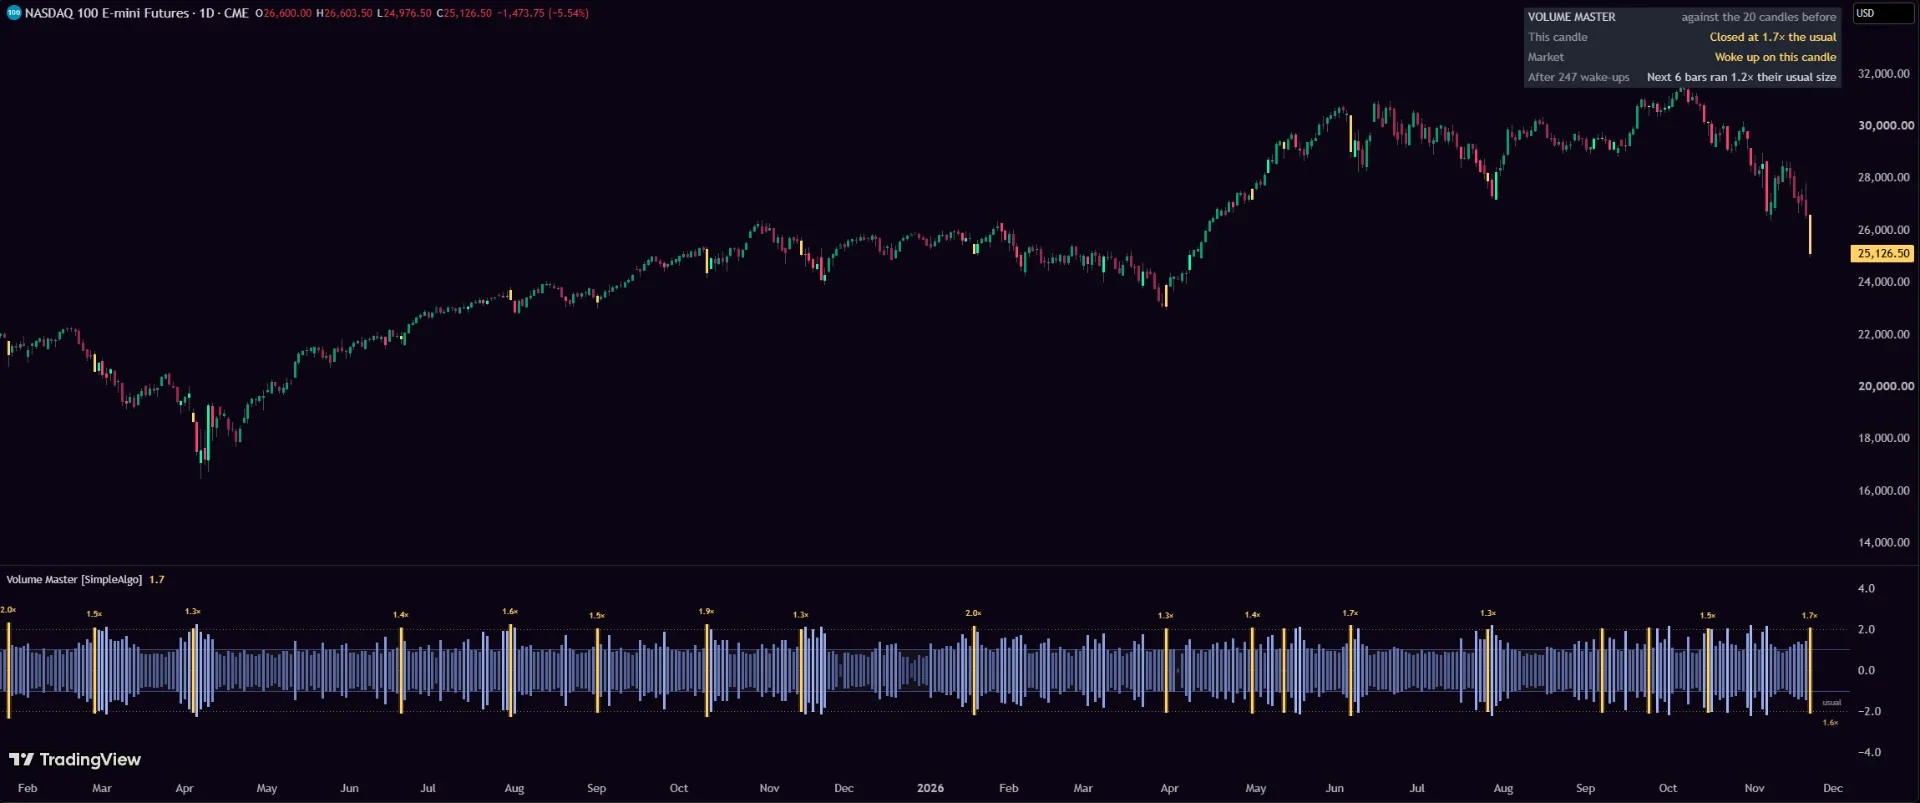
- A mirrored sound wave in its own pane. The edge of the grey band marks the usual volume for that candle's time of day, and the dotted line marks the 20-session high (the loud level).
- Waves inside the band are at or under usual volume; waves between the band and dotted line are busier than usual; waves through the dotted line are loud.
- A gold wave with its multiple above it marks a wake-up: the first loud candle after six candles that were not loud. Its candle on the price chart turns gold too, with a soft glow behind the six candles that follow.
- An outlined extension on the forming wave estimates where the live candle's volume is heading at its current pace.
- A plain-language corner panel summarizing the current candle, market state, six-bar range record and busiest time of day.
The usual, by time of day
A market is not equally busy all day: the opening candle routinely carries several times the volume of an overnight bar. Instead of comparing a candle to the bars immediately before it, Volume Master compares each candle to the same time slot over the last 20 sessions (for instance, the 09:30 candle against the last twenty 09:30 candles).
The single largest session in that slot is left out of the average so one extreme day does not distort what counts as usual. On daily charts and above there is one slot, so it compares against the previous 20 candles. Until a time slot has at least 10 prior sessions on the chart, it falls back to the prior 20 candles.
Loud candles and gold wake-ups
- Loud candle: volume exceeds the highest volume that time slot reached over the prior 20 sessions (or the highest of the prior 20 candles on daily charts and above).
- Wake-up: the first loud candle after six candles that were not loud. It draws in gold with its multiple of usual volume above the wave, turns the price candle gold, and places a soft glow behind the wake-up and the six bars after it.
- Soft ceiling: past the dotted loud line, the wave rises more slowly toward a fixed ceiling and brightens instead, keeping quiet days and extreme spikes readable on the same scale.
Pace of the forming candle
On intraday timeframes up to one hour, once one-third of the forming candle has elapsed, Volume Master projects its volume so far forward to the candle's close at the current speed. That estimate appears as an outlined extension on the latest wave.
Pace is an estimate until the candle closes and requires real-time data (on delayed feeds it is omitted or reads low). Once a live candle's actual volume crosses the loud threshold, the wake-up cannot be taken back because volume cannot shrink.
Corner panel
| Panel row | Meaning |
|---|---|
| Header | Shows whether the baseline is comparing against the same time of day (e.g. 20 sessions) or the 20 candles before. |
| This candle | Current or closed volume as a plain multiple of usual (for example, 1.7x the usual). |
| Market | Plain-language state such as Woke up on this candle, Loud, Busier than usual, or Quiet. |
| After N wake-ups | Historical record on this chart showing how large the six candles after earlier wake-ups were compared to usual candle range for their time of day. Needs at least five wake-ups and measures size only, not direction. |
| Usually busiest | On intraday charts with enough history, names the time slot with the highest usual volume on your chosen clock and counts down to it. |
Settings
| Setting | What it does | Default |
|---|---|---|
| Sessions to learn from | Number of prior sessions (10 to 60) for each time slot's usual average and loud threshold. Higher values make loud rarer; lower values make it more common. | 20 |
| Colour the candles | Fades candles under 0.6x usual, shows normal strength near usual, full strength halfway to loud, and gold on wake-ups. Turn off if another script colours your candles. | On |
| Glow after a wake-up | Soft background band behind the wake-up candle and the six candles after it. Automatically fades out when zoomed far out. | On |
| Pace of the forming candle | Shows the projected volume extension on the live bar once a third of the candle has passed (up to 1-hour charts). | On |
| Labels | Shows the multiple above each gold wake-up wave and the right-edge line labels. | On |
| Wave / Loud / Candles | Custom colours for normal waves, loud/wake-up highlights and price candles. | Blue / Gold / Mint & Pink |
| Text size | Small, Normal or Large text for labels and the corner panel. | Normal |
| Panel / Position | Auto sits in the top right of the price chart and moves to the bottom right when price is near the top. Or pick any corner. | On / Auto |
| Clock | Time zone used when the panel names the busiest time of day (Exchange, UTC, New York, Chicago, Los Angeles, London, Berlin, Dubai, Mumbai, Singapore, Tokyo, Sydney). | New York |
Alerts
- Wake-up: first loud candle after six non-loud candles.
- Waking up (early, by pace): forming candle is on pace to reach the loud level for its time of day.
- Loud candle: any candle with more volume than its time of day had on the prior sessions.
- Market went quiet: six consecutive candles with no loud bar.
Use Once per bar close for confirmed readings. The pace alert fires intrabar by design and is an estimate until the candle closes.
Notes and limits
- Volume Master requires volume data. Symbols or timeframes with no volume display an error message.
- Pace projection is an estimate and depends on real-time data.
- The six-bar wake-up record measures historical candle range (size), not direction, and past volatility does not guarantee future movement.
- When zoomed far out, overlapping wake-up labels and the six-bar glow automatically thin out to keep the chart readable.
Common questions
Yes. It is free and open source on TradingView, with no SimpleAlgo membership required.
A standard volume bar compares every candle to the same moving average, so the market open always looks huge and midday always looks dead. Volume Master compares each intraday candle to the same time of day over the last 20 sessions.
It is the first candle whose volume beats the 20-session high for its time of day after at least six candles that were not loud.
No. Once a candle's actual volume crosses the loud threshold, volume cannot shrink, so a wake-up mark is never taken back.
No. It only compares how large the combined range of the six candles after earlier wake-ups was against usual candle size for that time of day.