Timeframe Master
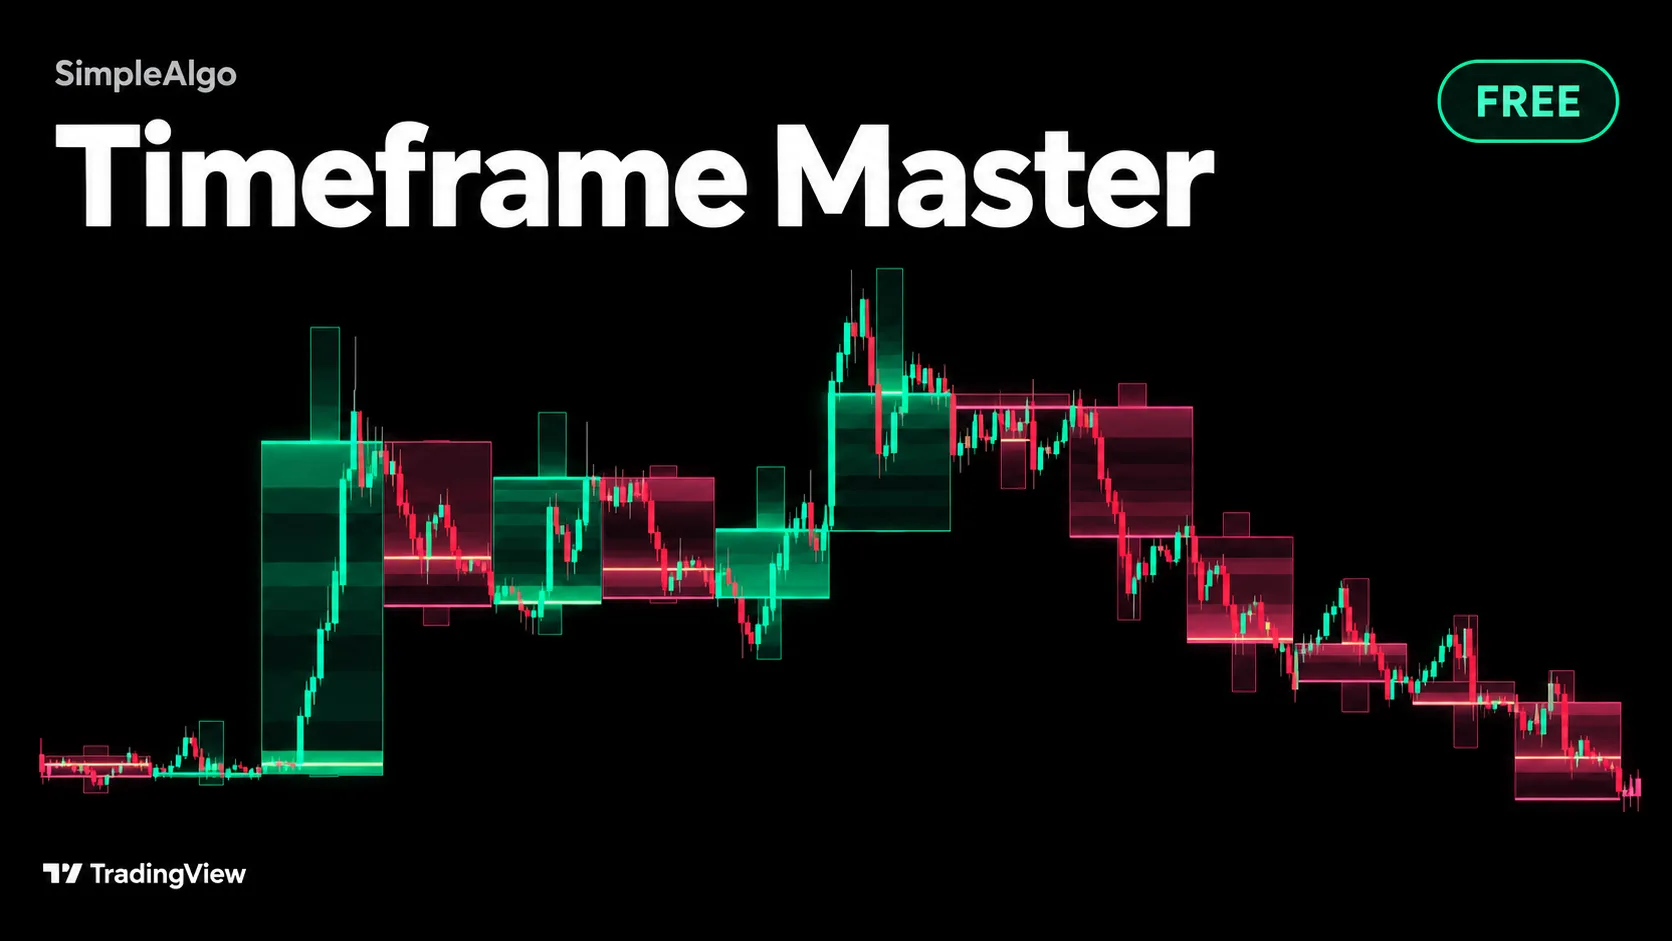
What is the bigger candle doing right now? Timeframe Master draws the candle one timeframe up behind your chart, so you can see the hour while you trade the 5 minute, or the day while you trade the hour. Each candle glows where price spent its time, and a small panel puts it into words.
Getting started
- 1Open TradingView and click IndicatorsSearch for "Timeframe Master SimpleAlgo" in the Community scripts tab.
- 2Add Timeframe Master to your chart
- 3Keep the defaultsAuto picks the bigger timeframe for you, so it works on any chart without changes.
- 4Add alerts if you want themSet them to "Once per bar close".
What you see on the chart
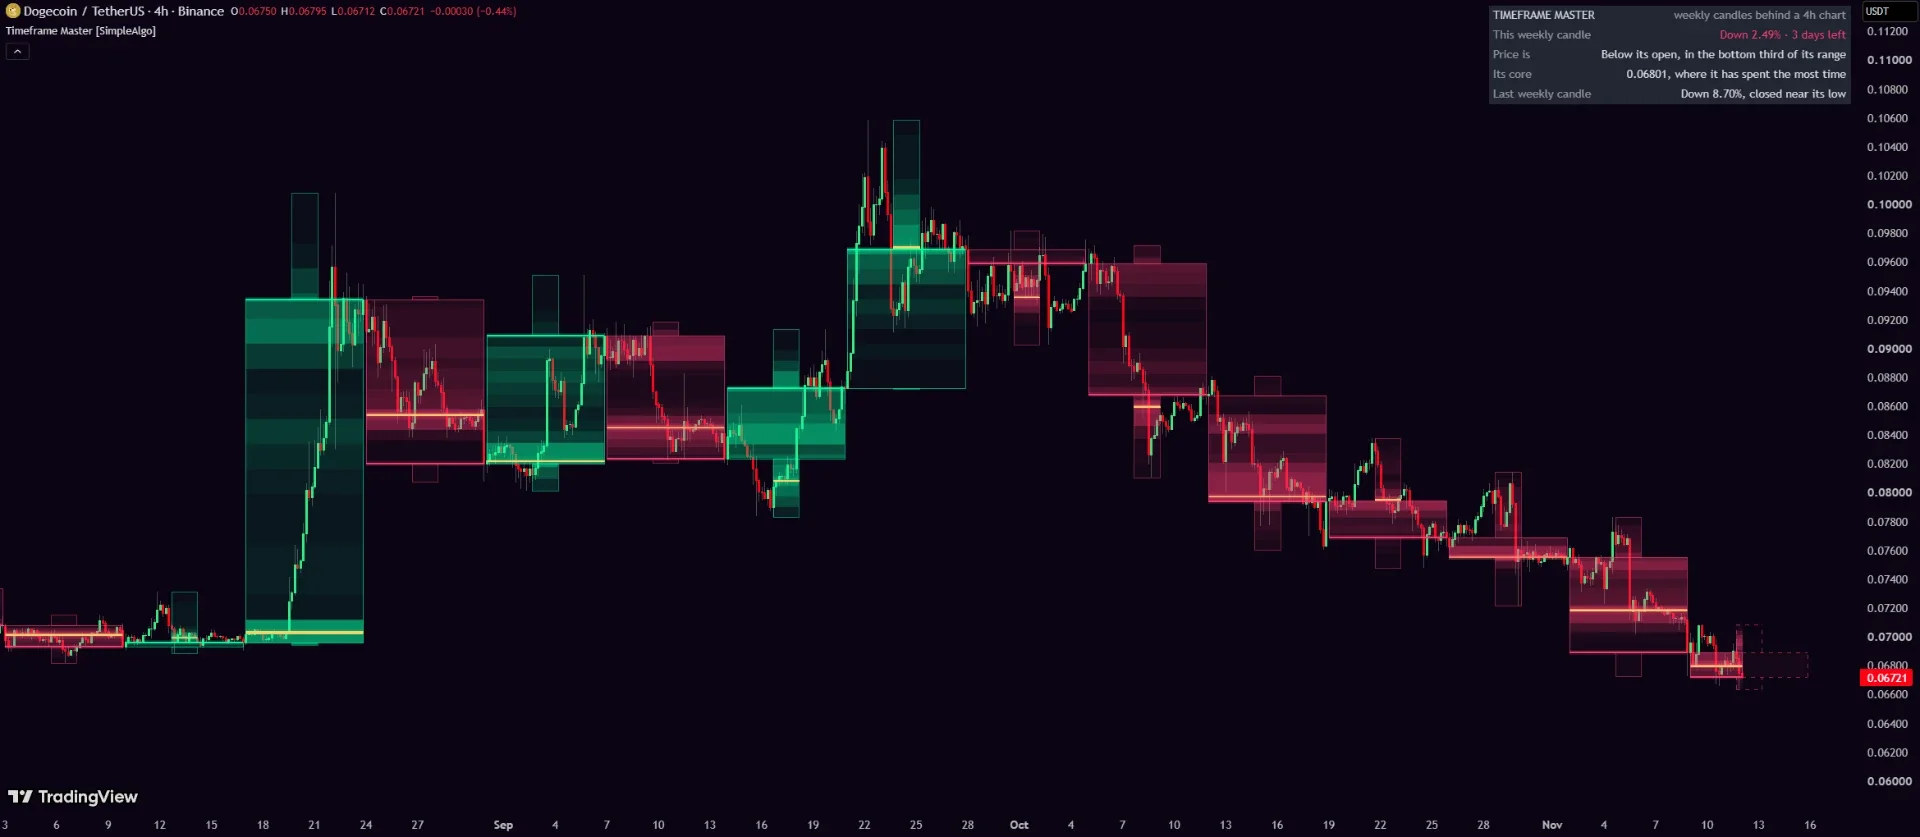
- The bigger candle behind your bars. Its body runs the full width of the bars it covers, and its wicks are a narrow column down the middle.
- Lantern rows. The candle is cut into rows from its low to its high, and each row glows by how many of the bars inside it traded there. Bright rows are where price spent its time.
- The core line, on the row that saw the most trading. It is a record of that candle, not a level to trade from.
- The candle still forming, drawn the same way inside a dashed outline that runs out to where it is due to close.
- A panel: which candles are drawn, how this candle is moving and how long it has left, where price sits in it, its core, and how the last one closed.
How it works
Built from your chart's own bars
Each bigger candle's open is the first bar's open, its close the last bar's close, and its high and low the extremes in between. Nothing is requested from another timeframe and nothing looks ahead.
Auto timeframe
| Your chart | Bigger candle |
|---|---|
| 1 minute | 15 minutes |
| 2 or 3 minutes | 30 minutes |
| 4 or 5 minutes | 1 hour |
| 10 minutes | 2 hours |
| 15 or 20 minutes | 4 hours |
| 30 minutes to 2 hours | 1 day |
| 3 to 12 hours | 1 week |
| Daily | 1 month |
Auto picks the smallest usual timeframe that holds at least ten of your chart's bars. If you choose a timeframe that holds fewer than four bars, not a whole number of them, or far too many, it falls back to Auto.
Extended hours
On a stock chart with extended hours on, the bars before the open and after the close are chart bars too, so daily and bigger candles include them. Switch extended hours off for the regular session's candle.
How to use it
Read the colour first: the bigger candle is up or down from its open. Then check where price sits inside it with the "Price is" row, for example above its open in the top third of its range. The core shows where the bigger candle has done most of its business so far.
Use it to keep the bigger picture in view while you work a smaller chart, so a pullback on the 5 minute reads differently when the hourly candle is strongly up.
Settings
| Setting | What it does | Default |
|---|---|---|
| Bigger timeframe | Auto, or 5 minutes up to 1 month. | Auto |
| Bigger candles to draw | How many recent candles stay on the chart. About 115 is the most TradingView allows one script to draw. | 120 |
| Lantern | Rows glow by time spent. Off gives a plain body lit at its close with a thin wick. | On |
| Core line | Line on the busiest row, with its colour. Needs the lantern. | On |
| Colours | Mint and Pink, Ice, Neon or Custom. | Mint and Pink |
| Brightness | How strongly the rows glow, 1 to 5. | 3 |
| Text size / Panel | Panel text size, show or hide the panel, and its corner. | Normal, bottom left |
Alerts
- A new bigger candle has opened.
- Bigger candle turned up: price is back above the bigger candle's open.
- Bigger candle turned down: price has dropped below the bigger candle's open.
Set alerts to "Once per bar close".
Notes and limits
- The candle still forming changes until it closes, like any candle.
- The core line is a record of each candle, not a level to trade from.
- TradingView limits how much one script can draw, so very long histories show only the most recent candles.
Common questions
Yes. It's free and open source on TradingView, no membership needed.
Finished bigger candles are built from closed bars and don't change. The candle still forming updates until it closes, like any live candle. Nothing looks ahead.
Auto picks one for your chart, for example the hour on a 5 minute chart and the day on a 1 hour chart. You can choose your own in the settings.
The row inside each bigger candle where its bars spent the most time.
With extended hours on, pre-market and after-hours bars are included. Switch extended hours off for the regular session's candle.