VWAP Master
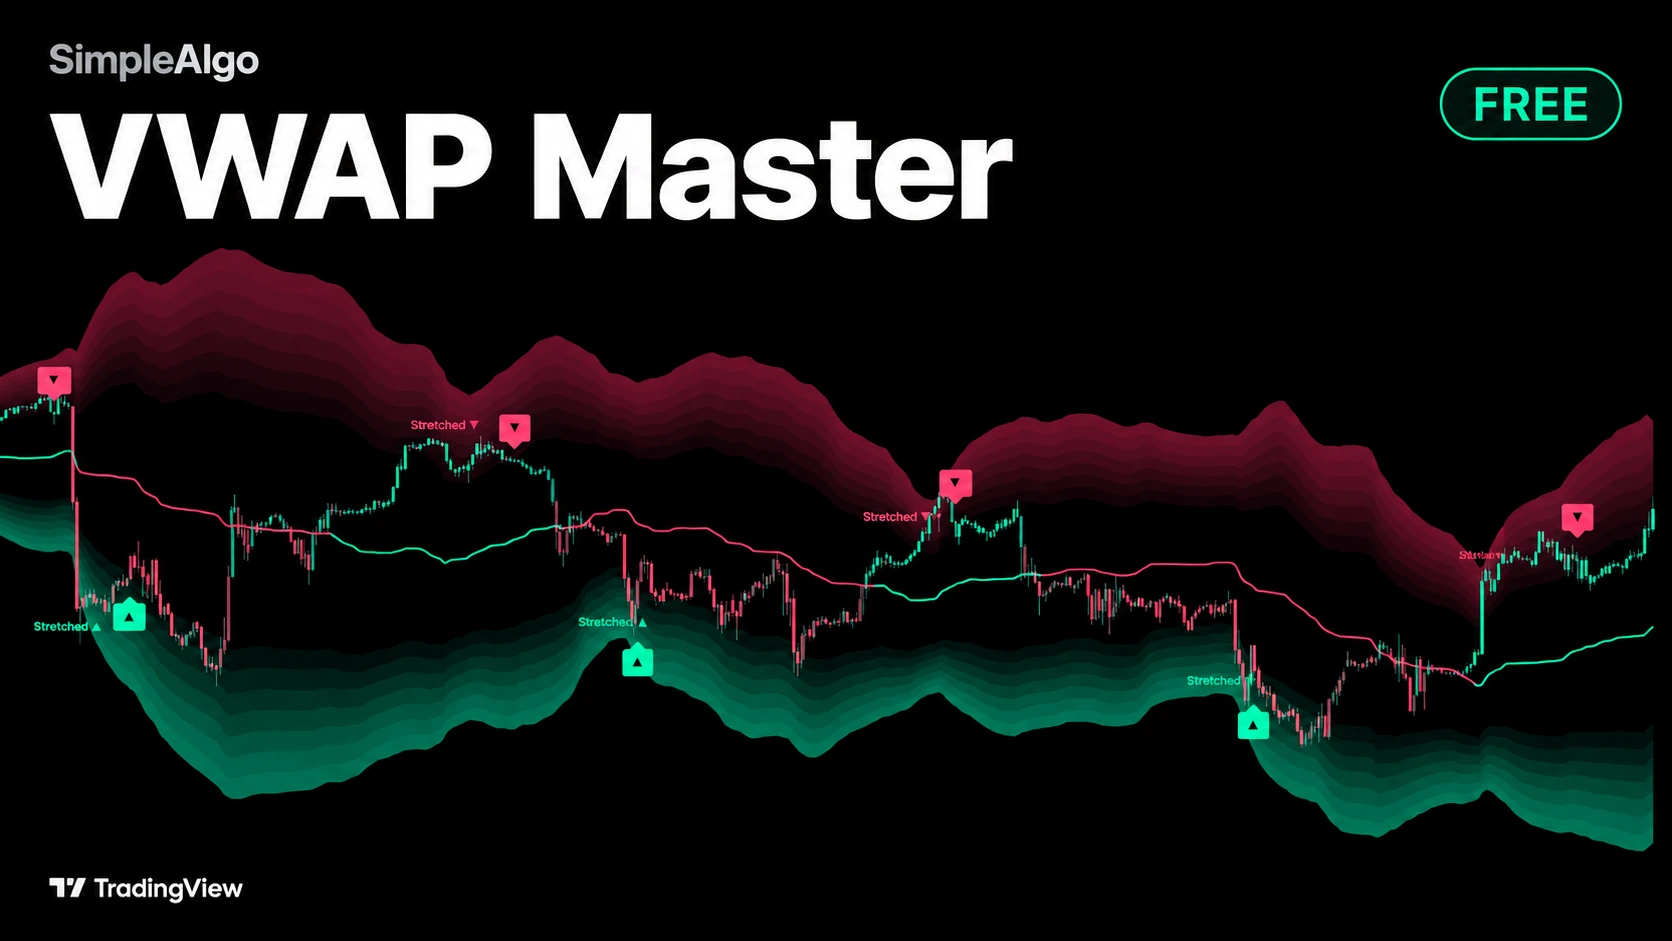
Is price above value or below it, how far has it stretched, and has it started coming back? VWAP Master draws the line, a gradient band on each side for the stretched zone, colours the candles by where price is, and prints only two things: a Stretched tag and a bounce arrow.
- Pullback Master (0:30): spotting pullbacks inside a trend
- RSI Master (2:51): reading momentum more clearly
- VWAP Master (4:23): where fair value sits during the session
- Trend Master (6:36): filtering out chop by trend direction
- Reversal Master (7:48): seeing when a move is stretched
Getting started
- 1Open TradingView and click IndicatorsSearch for "VWAP Master SimpleAlgo" in the Community scripts tab.
- 2Add VWAP Master to your chart
- 3Keep the defaultsRolling VWAP over 100 bars works on any timeframe. Switch to Session for the classic intraday VWAP.
- 4Add alerts if you want themSet them to "Once per bar close".
What you see on the chart
- The VWAP line. It turns the up colour once price has closed at least 0.3 deviations above VWAP for 3 bars, and the down colour for the same below.
- Two gradient bands, from 1.5 to 3.25 deviations. The top band is in the down colour and the bottom in the up colour, because that's the way a bounce off each goes.
- Candles coloured by distance from VWAP. Dim candles right on the line mean price is at value and nobody has the edge.
- A Stretched tag the first time a visit to a band reaches 2 deviations. One per visit.
- A bounce arrow when price turns back toward VWAP. A + means price reached the outer edge of the band first.
- A panel showing deviations from VWAP, status, VWAP direction and the last event.
How it works
VWAP and anchors
By default it's a rolling VWAP: the volume-weighted average of typical price over the last 100 bars. It never resets, so the line and bands stay smooth. Switch the anchor to Session, Week, Month or Year for the classic version, which restarts each period with a small break in the line.
Deviation and bands
Deviation is the volume-weighted standard deviation around VWAP over the same window, lightly smoothed in rolling mode and never below a third of an ATR, so the first bars after a reset don't all look stretched. Each band is seven layers a quarter deviation wide, faint inside and brightest at the outer edge.
Stretched and bounce
A visit starts when a bar closes 1.5 deviations or more from VWAP. The first time it reaches 2 deviations, the Stretched tag prints. After that, the first bar that closes back inside the 1.5 line on a candle pointing at VWAP gets an arrow, as long as the turn happens within 3 bars of the last close inside the band.
One per visit
A visit isn't over until price is back within half a deviation of VWAP. A second arrow on the same visit needs price to go at least half a deviation deeper, and there are never fewer than 10 bars between two arrows on the same side. That keeps the chart clean.
Trend
The panel shows whether VWAP is rising, falling or flat over the last 20 bars, and you can skip bounces that go against it.
How to use it
Start with the line and the candles: up colour, price is holding above value; down colour, below. The bands are the stretched zone. The tag is the heads-up, the arrow is the turn.
Before acting on an arrow, check the VWAP row in the panel. A bounce up toward a rising VWAP is a pullback in an uptrend. A bounce up toward a falling one is a fade against the trend and needs more care. To see only the first kind, turn on Skip bounces against the trend.
- Rolling: a smooth read on any timeframe.
- Session: the intraday VWAP most traders reference.
- Week or Month: suited to swing trading.
Settings
| Setting | What it does | Default |
|---|---|---|
| Anchor | Rolling, Session, Week, Month or Year. | Rolling |
| Rolling length | Bars in the rolling VWAP. | 100 |
| Show bands | Draws the gradient deviation bands. | On |
| Band start | Where the band begins, in deviations. | |
| Band smoothing | How much the bands are smoothed in rolling mode. | |
| Bounce signals / Stretched tags | Show or hide each event. | On |
| Skip bounces against the trend | Hides bounces that go against the VWAP direction. | Off |
| Candle colouring / Panel | Colour candles by distance from value; show the panel and set its position. | On |
| Theme | Neon, Classic, Aurora, Ice or Custom, plus glow on the line and label distance. | Neon |
Alerts
- Stretched above value, Stretched below value.
- Bounce down, Bounce up. The message says if it was a + bounce.
Set alerts to "Once per bar close". Tags and arrows are decided on closed bars and never move afterwards.
Notes and limits
- The rolling anchor is a volume-weighted moving average, not the session VWAP. Switch to Session if that's what you want.
- On forex and CFDs volume is usually tick volume.
- Symbols with no volume use a time-weighted version, and the panel says no volume.
- In anchored modes the bands are narrow right after a reset and widen as the period builds.
- Mean reversion to value works best in ranges. In strong trends price can hold inside a band for a long time.
Common questions
Yes. It's free and open source on TradingView, no membership needed.
Tags and arrows are decided on closed bars and never move. The line, bands and candle colours update on the live bar like any moving average. The panel reads the last closed bar.
Signals are one per visit. A visit only ends when price is back within half a deviation of VWAP.
Price reached the outer edge of the band before turning.
Rolling gives a smooth read on any timeframe. Session is the classic intraday VWAP that resets each day.