Simple Oscillator Pro
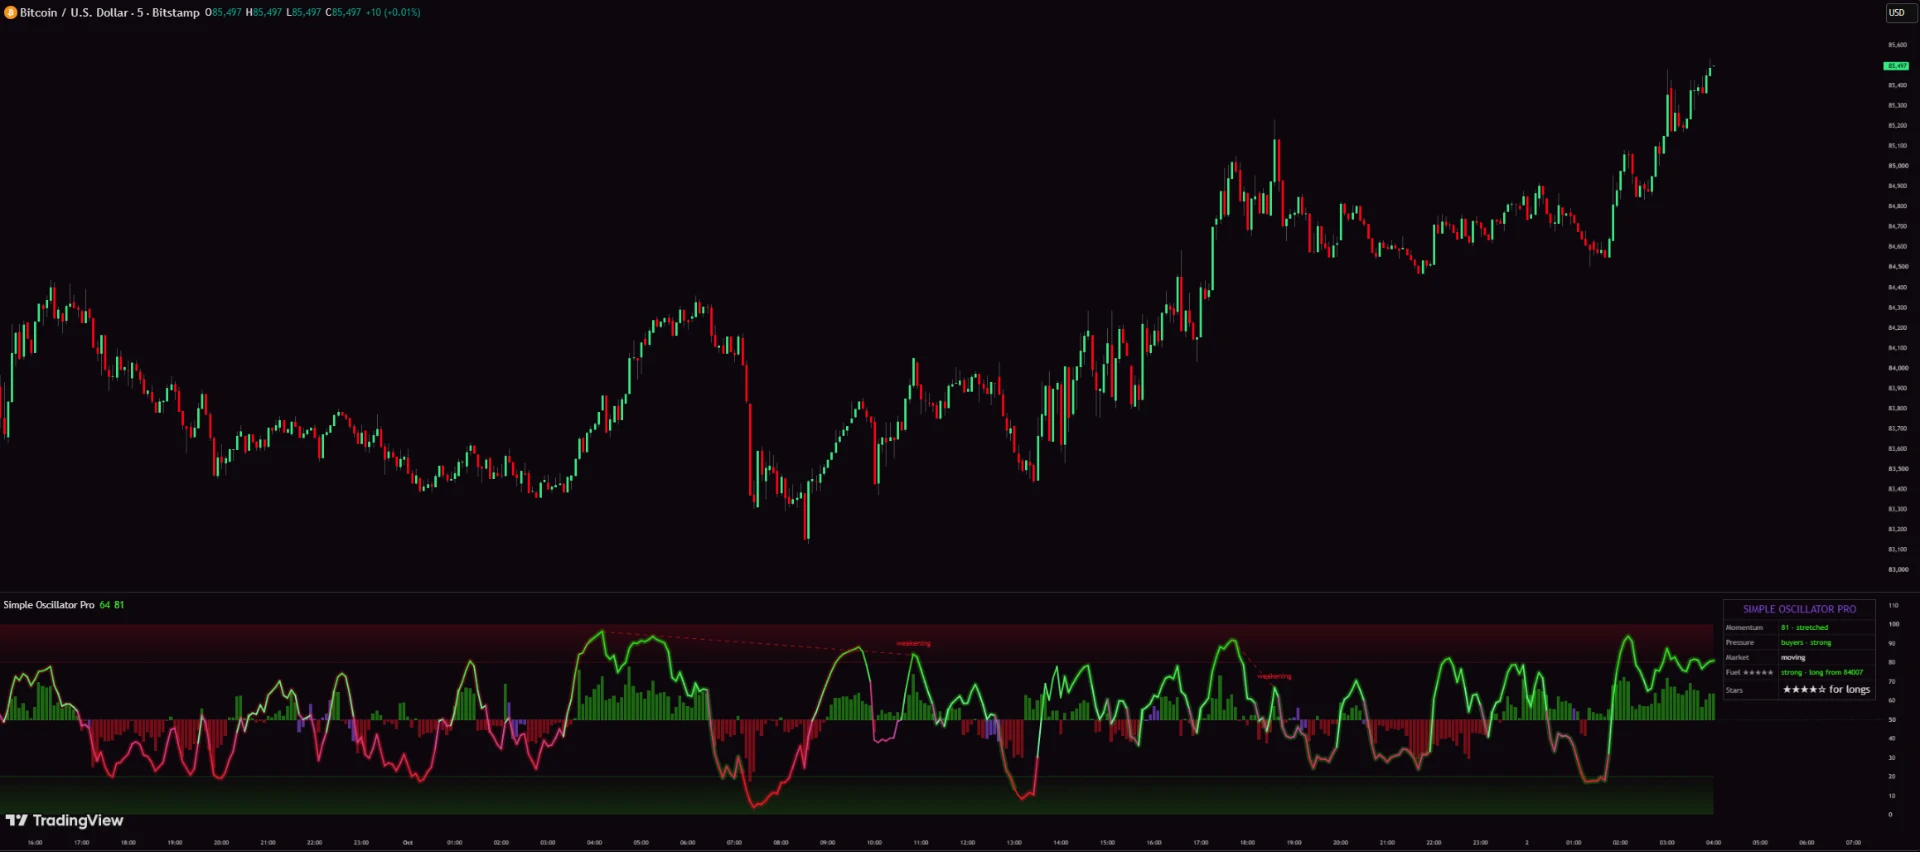
One question, answered at a glance: is momentum with you or against you? Simple Oscillator Pro sits in its own pane under your chart and helps you read momentum and manage trades. It isn't a buy or sell signal.
What it is
It's a TradingView indicator that shows in a separate pane whether momentum is with you or against you. It runs on the same trend engine as our Pro Signals indicator, so the two agree when they use the same Signal Mode. It also works on its own.
Getting started
- 1Open TradingView and click IndicatorsThen open the Invite-only scripts tab.
- 2Choose Simple Oscillator ProIt opens in a new pane under your chart.
- 3Keep the defaultsIf you use Pro Signals too, set the same Signal Mode and Minimum stars in both.

Momentum Line (0 to 100)
The line measures how far price is from its 13 bar average, in ATR units. That means a reading means the same thing on any symbol or timeframe.
- 50 means price is on its average.
- Above 50 means momentum is up. Below 50 means momentum is down.
- 80 and above is stretched high (about 1.5 ATR above the average). 20 and below is stretched low.
- It's a smooth curve. It gets close to 0 and 100 but never flattens against them.
- It's green above 50 and red or pink below.
Pressure columns
The columns show who's in control on recent candles. They're based on where each candle closes within its range, weighted by volume.
- Green above the midline means buyers are pushing.
- Red below the midline means sellers are pushing.
- Taller columns mean stronger pressure.
- On symbols with no volume data, candle direction is used alone.
Zones
The shaded areas above 80 and below 20 are where moves tend to cool off.
Stars (1 to 5)
You get one star per check, rated for the direction of the current trend:
- The next timeframe up trends the same way.
- The timeframe above that trends the same way.
- Volume is above its 20 bar average (or a strong close, on symbols without volume).
- Room to run: price hasn't reached the reversal zone.
- Clean market: 2 or fewer trend changes in the last 30 candles.
| Setting | What it does |
|---|---|
| 1m to 3m charts | Use 15m and 1H |
| 5m to 10m charts | Use 1H and 4H |
| 15m to 30m charts | Use 4H and Daily |
| 1H to 2H charts | Use Daily and Weekly |
| 4H to Daily charts | Use Weekly and Monthly |
Hover the stars in the dashboard to see which checks passed. Stars are not a win rate.
Trade Fuel
Trade Fuel tracks trades with the same rules as Pro Signals. A trade opens when price crosses the trend line with momentum on its side. The stop is based on volatility, and targets sit at 1x, 2x and 3x the risk. The stop moves to entry after the first target. The trade closes at the stop, the third target, or a trend flip.
While a trade is open, the line glows in the trade's color and the dashboard shows the direction, entry price, the trade's stars and its fuel.
| Setting | What it does |
|---|---|
| Strong (green) | Momentum and pressure both support the trade. |
| Fading (purple) | Momentum agrees, but pressure has turned against it. |
| Empty (red) | Momentum crossed to the other side of 50. |
Weakening (on by default)
Weakening shows up when price makes a new high or low, but momentum is at least 10 points weaker than the previous strong peak (70 or above) or trough (30 or below), 8 to 80 candles later.
- You'll see a dashed line between the two points and a "weakening" label.
- It appears 5 candles after the turn, once it's confirmed. It never repaints.
Momentum Shifts (off by default)
A dot marks the first time momentum turns inside a zone. Treat it as a take profit hint, not a reason to trade against the trend.
Coiling (off by default)
Columns turn purple when the market compresses: tight volatility for 3 candles in a row with momentum near the middle. A bigger move often follows.
Trend Strip and Trend Background (off by default)
- Trend Strip: three colored bands under the oscillator showing the trend on the current timeframe and the two above.
- Trend Background: a light pane tint in the current trend color.
Dashboard
| Setting | What it does |
|---|---|
| Momentum | The value, and whether it's rising, falling or stretched. |
| Pressure | Buyers or sellers, strong or light. |
| Market | Moving or coiling. |
| Fuel | The trade's stars, strong, fading or empty, and "long/short from [entry]". |
| Stars | The live rating for the current trend direction. |
Settings
| Setting | What it does | Default |
|---|---|---|
| Signal Mode | Conservative means fewer trend changes and wider stops. Aggressive means more trend changes and tighter stops. Balanced sits in between. Match Pro Signals. | Conservative |
| Minimum stars | Only track trades with at least this many stars. Match Pro Signals. | All signals |
| Momentum Line | Shows the 0 to 100 line. | On |
| Pressure Histogram | Shows the Pressure columns. | On |
| Zones | Shades the areas above 80 and below 20. | On |
| Trend Background | Tints the pane in the trend color. | Off |
| Momentum Shifts | Dots on the first turn inside a zone. | Off |
| Weakening | Dashed line and label when a push is weaker than the last one. | On |
| Coiling | Purple columns when the market compresses. | Off |
| Trend Strip | Three trend bands under the oscillator. | Off |
| Trade Fuel | Tracks the open trade and its fuel. | On |
| Dashboard | Can sit in any corner. | On, Top Right |
| Bull, Bear, Accent colors | Colors used across the pane. | Match Pro Signals |
Alerts
We recommend one alert with the condition "Any alert() function call." It sends momentum shifts, weakening, coiling starting and ending, fuel fading or empty, and five star conditions, each with the symbol and timeframe.
- 1Click Alert in TradingView
- 2Choose Simple Oscillator Pro
- 3Choose "Any alert() function call"
- 4Set "Once per bar close"
- 5Create
Prefer separate alerts? Pick one of these instead: Momentum Shift, Weakening, Coiling Started, Fuel Empty, Five Stars.
Repainting
Dots, labels, trade tracking and alerts only happen on closed candles. Higher timeframe data comes from the last closed higher timeframe candle. The line, columns and colors update live until the candle closes, like any oscillator.
Common questions
Dots, labels, trade tracking and alerts only happen on closed candles, and higher timeframe data comes from the last closed higher timeframe candle. The line, columns and colors update live until the candle closes, like any oscillator.
No. Simple Oscillator Pro works on its own. If you use both, they agree when they use the same Signal Mode.
The two tools are using a different Signal Mode or Minimum stars. Set them the same in both.
Yes. Strong trends keep momentum stretched.
Weakening compares two pushes. Momentum Shifts mark the first turn inside a zone.
Coiling is turned on and the market is compressing.
All of them. The star timeframes adjust automatically.
No. Stars show how many of five checks passed. They don't predict the outcome of a trade.