Profile Master
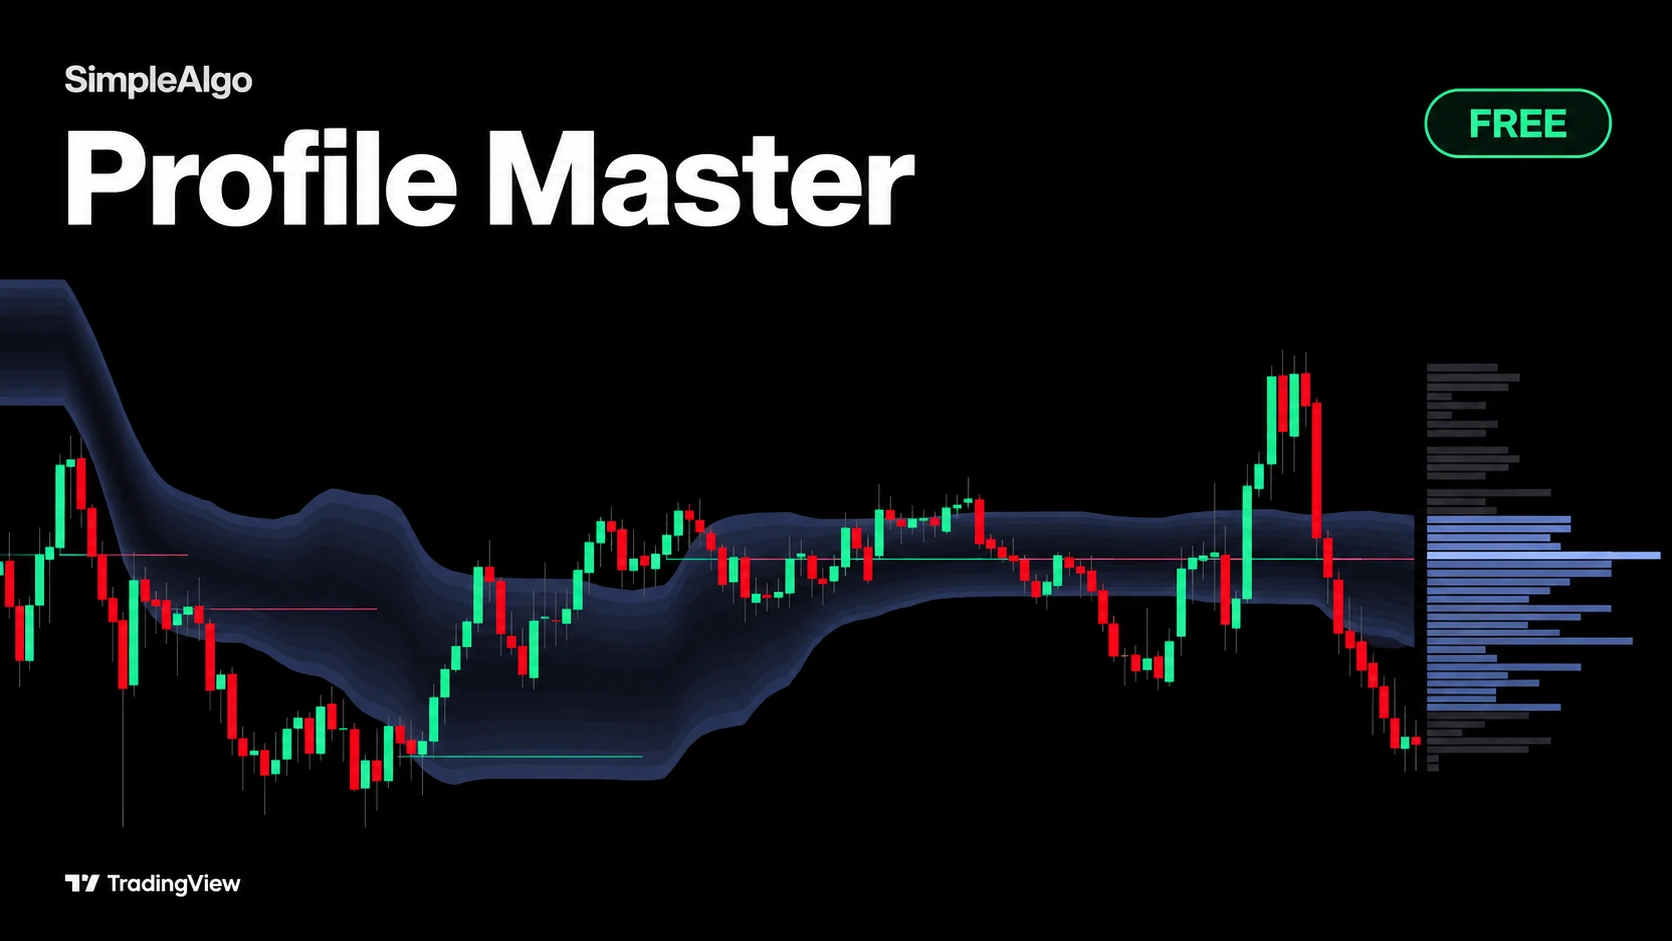
A volume profile answers one question: where has the market been doing business? Profile Master draws the answer as a cloud that travels with the chart, so you see not just the levels but how value moved while price moved. It's free and open source.
What it is
The usual ways of showing a profile, a histogram pinned to the side of the chart or a stack of session boxes, answer the question for one moment. Profile Master answers it on every bar.
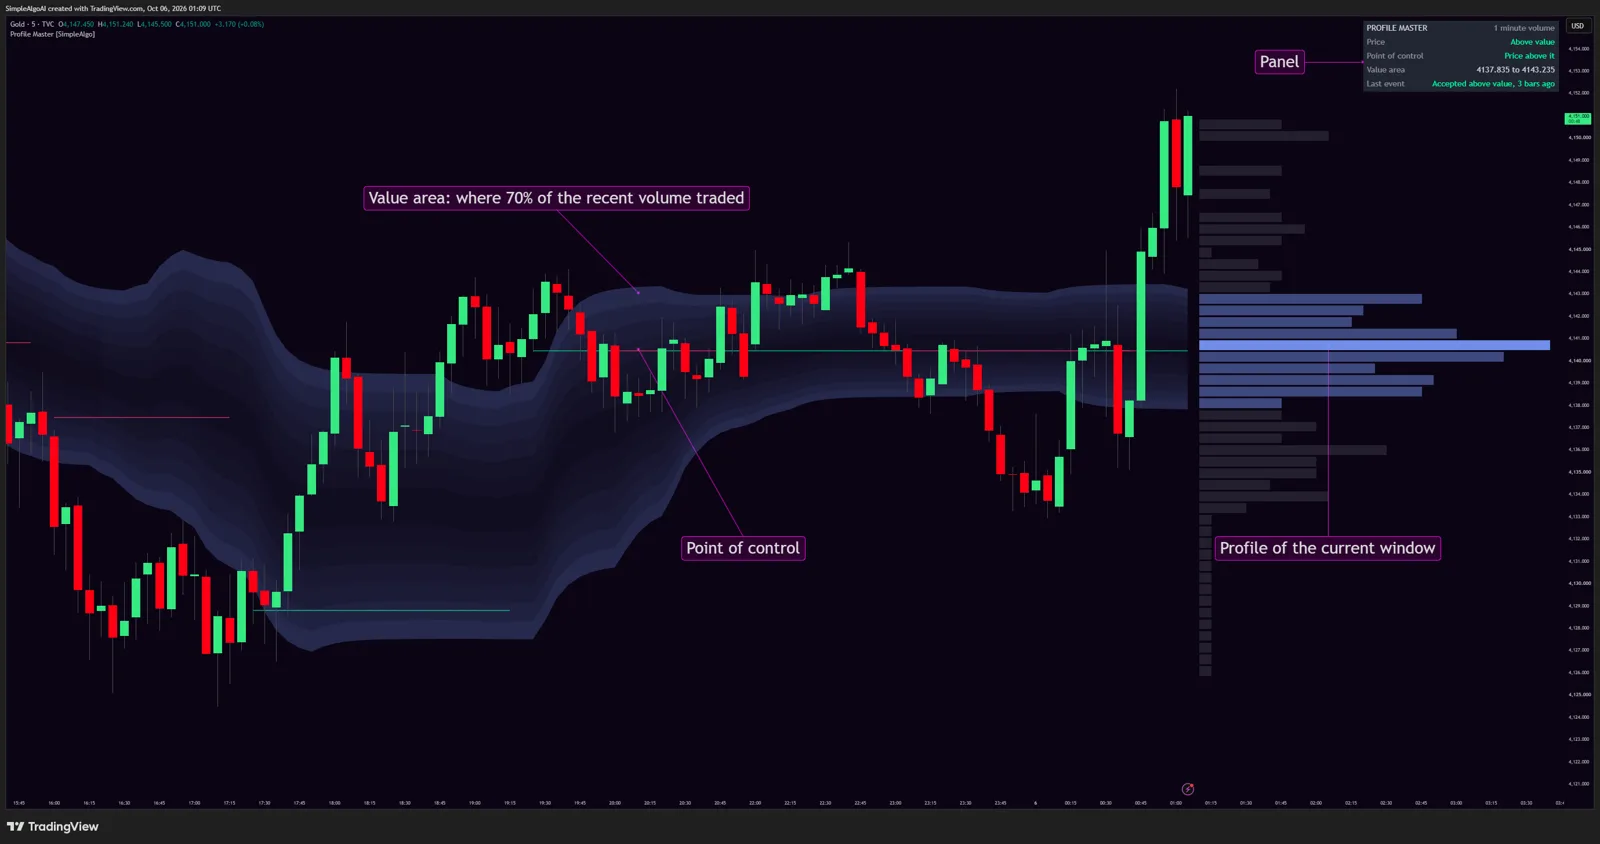
- The cloud is the value area: the range holding 70% of the volume in the cluster the market is trading in, built from the last 90 bars.
- The thin line inside it is the point of control, the price where the most volume changed hands.
- Both are rebuilt on every bar from lower timeframe volume at price.
- Older bars fade out of the profile gradually instead of dropping off a cliff, so the cloud bends with the market instead of jumping.
Getting started
- 1Open TradingView and click IndicatorsSearch for "Profile Master SimpleAlgo" in the Community scripts tab.
- 2Add Profile Master to your chartIt draws on the price chart, with a small panel in the corner.
- 3Keep the defaults90 bars, 70% value area and automatic lower timeframe are a good start on any market.
- 4Add alerts if you want themPick an event and set "Once per bar close".
What you see on the chart
The cloud
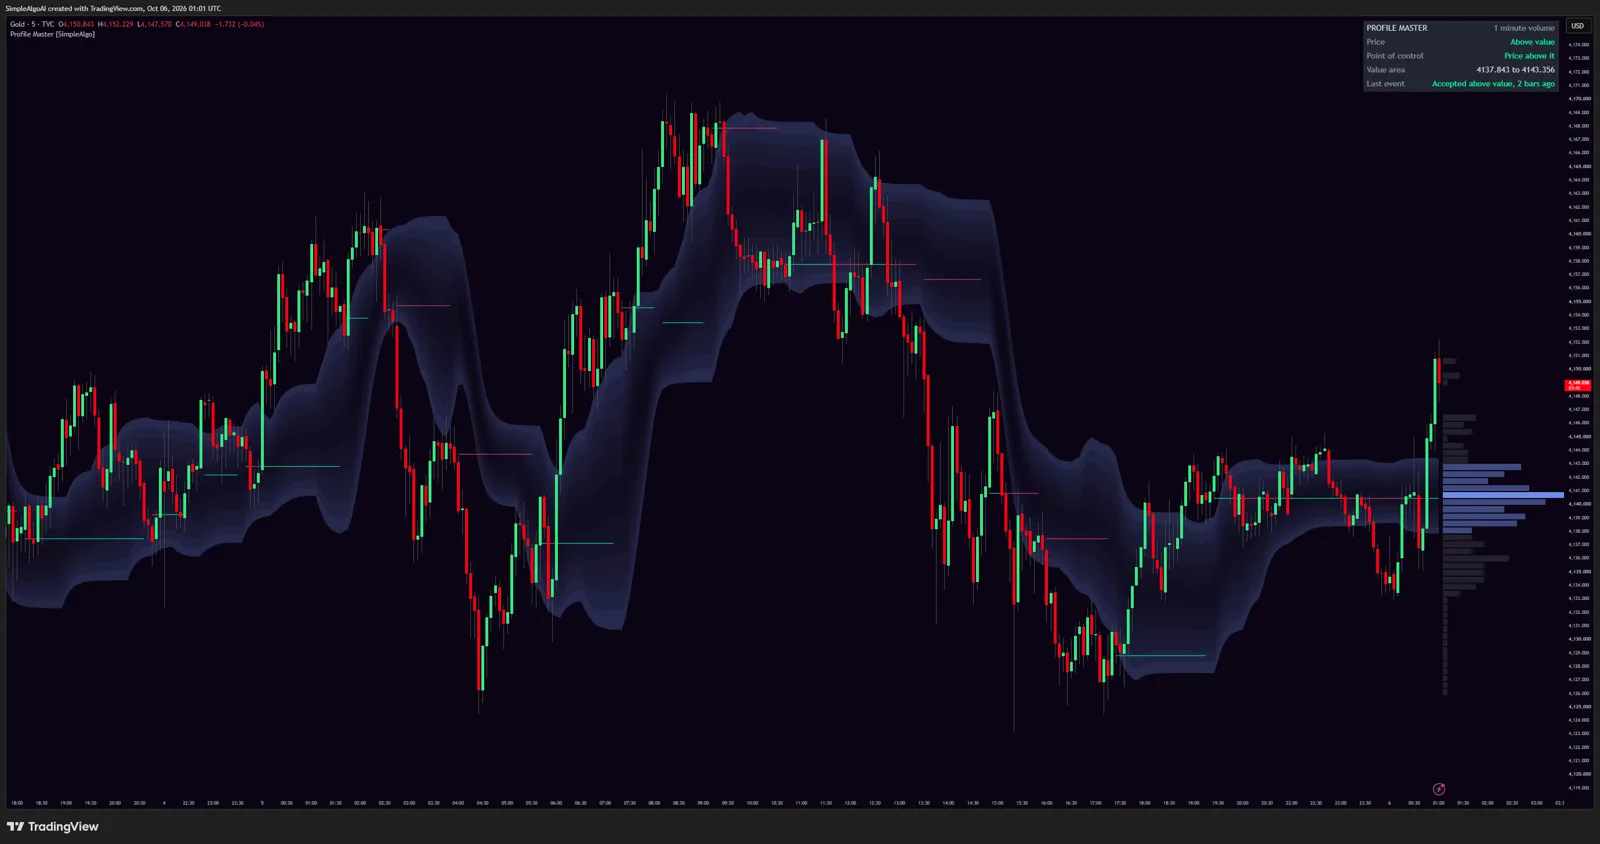
The value area is drawn as fourteen slices of one colour, faint in the middle and densest at the edges. The edges are the levels you trade against, so they're the part you should see. While value is moving from one cluster to another the whole cloud fades, and it comes back to full strength once it arrives.
The point of control
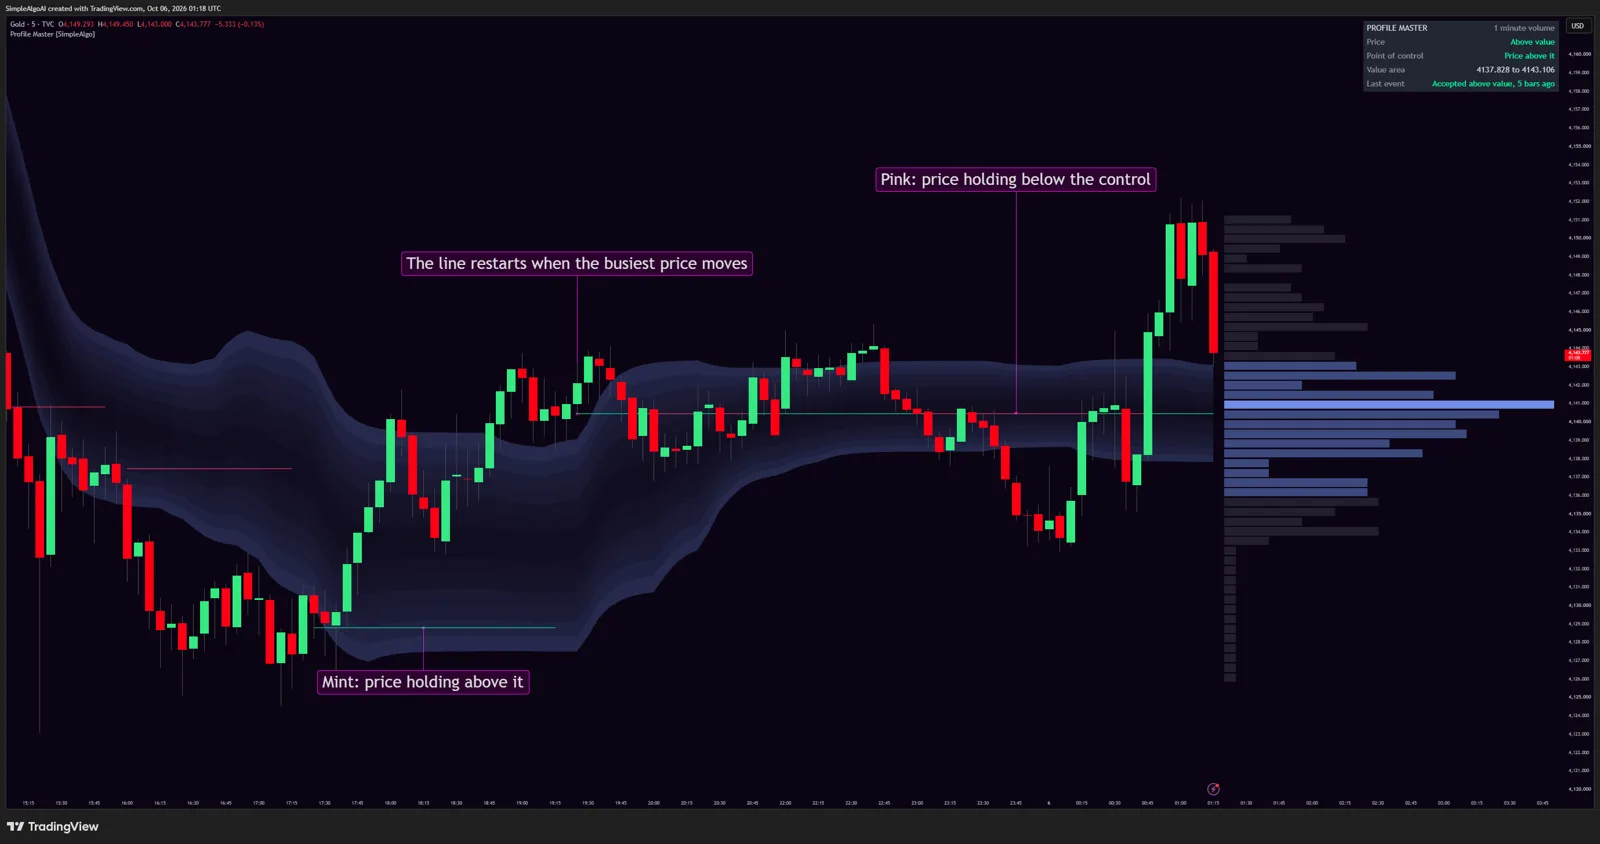
The busiest price is drawn as horizontal level segments: mint while price holds above it, pink while it holds below. When the busiest price moves, the line restarts at the new level instead of drawing a staircase, and short-lived levels are left out. What's left is a handful of prices that mattered.
The profile at the right edge
A small histogram of the current window is drawn past the last bar: value rows in the cloud colour, the control row lit, everything else grey. It's the classic picture of the same data, and it's where a second cluster shows up before the cloud moves to it.
The panel
- Price: above, below or inside value. While a change is still confirming it says so (for example Above value, close 1 of 2).
- Point of control: whether price is above or below it.
- Value area: the current low and high of the cloud.
- Last event: the most recent event and how many bars ago, or a quiet note such as Value caught up to price.
The four events
Price is inside, above or below the cloud. A change counts after two closes on the new side, and only if price did the moving: over the confirming bars, price has to travel at least as far as the edge it crossed moved toward it.
| Event | What it means |
|---|---|
| Accepted above value | Price closed above the cloud, stayed there, and got there under its own steam. The start of a move away from value. |
| Accepted below value | The same, below the cloud. |
| Back into value from above | Price was above the cloud, came back in and stayed. |
| Back into value from below | Price was below the cloud, came back in and stayed. |
If the cloud moved to meet price, or moved away from it, nothing fires and nothing is marked. The panel's Last event row says what happened instead: Value caught up to price, Value moved below price, or Value moved above price.
How to use it
Read the cloud first
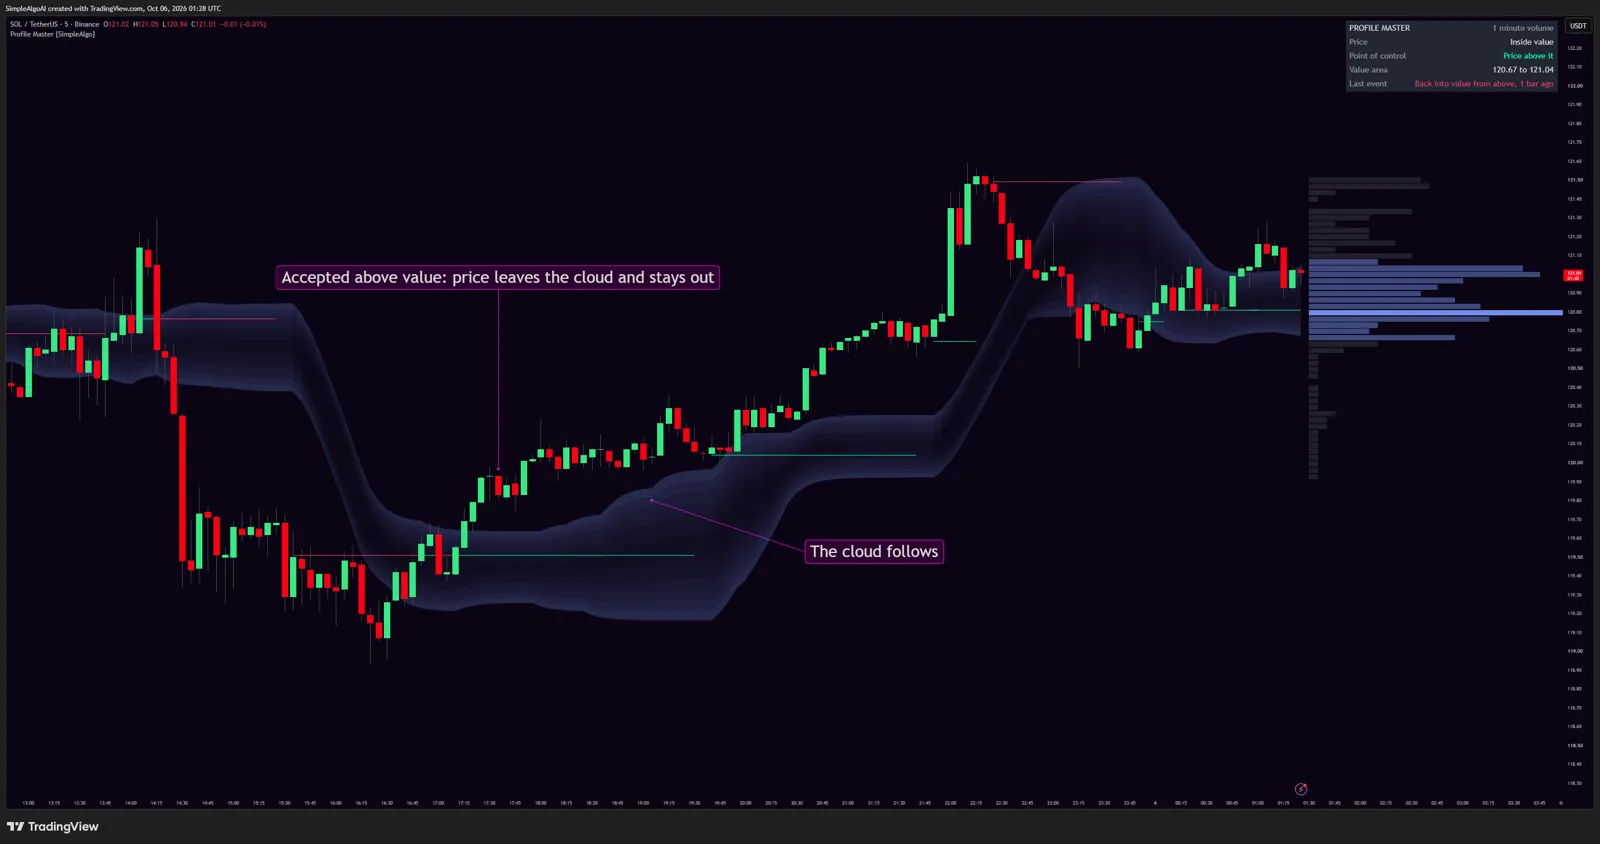
Inside the cloud, the market is doing business where it has been doing business. Expect rotation between the edges and around the control. Outside it, the market is away from value and one of two things happens: it gets accepted there, a new cluster builds and the cloud travels to it, or it gets rejected and price comes back in. While that's being decided, the right-edge profile shows the new cluster growing in grey.
The edges are the levels
The top of the cloud is where buyers have been paying up and the bottom is where sellers have been letting go. Price coming down to the bottom edge from inside is a pullback to the cheap end of value. Price pushing through the top edge and holding there is a market that has decided value is higher.
The control is the fulcrum
The busiest price is where the two sides agreed the most. A long pink segment under a rising market usually isn't a problem. A pink segment forming while price sits right on top of it, after a long run, is worth a second look.
Acceptance and rotation
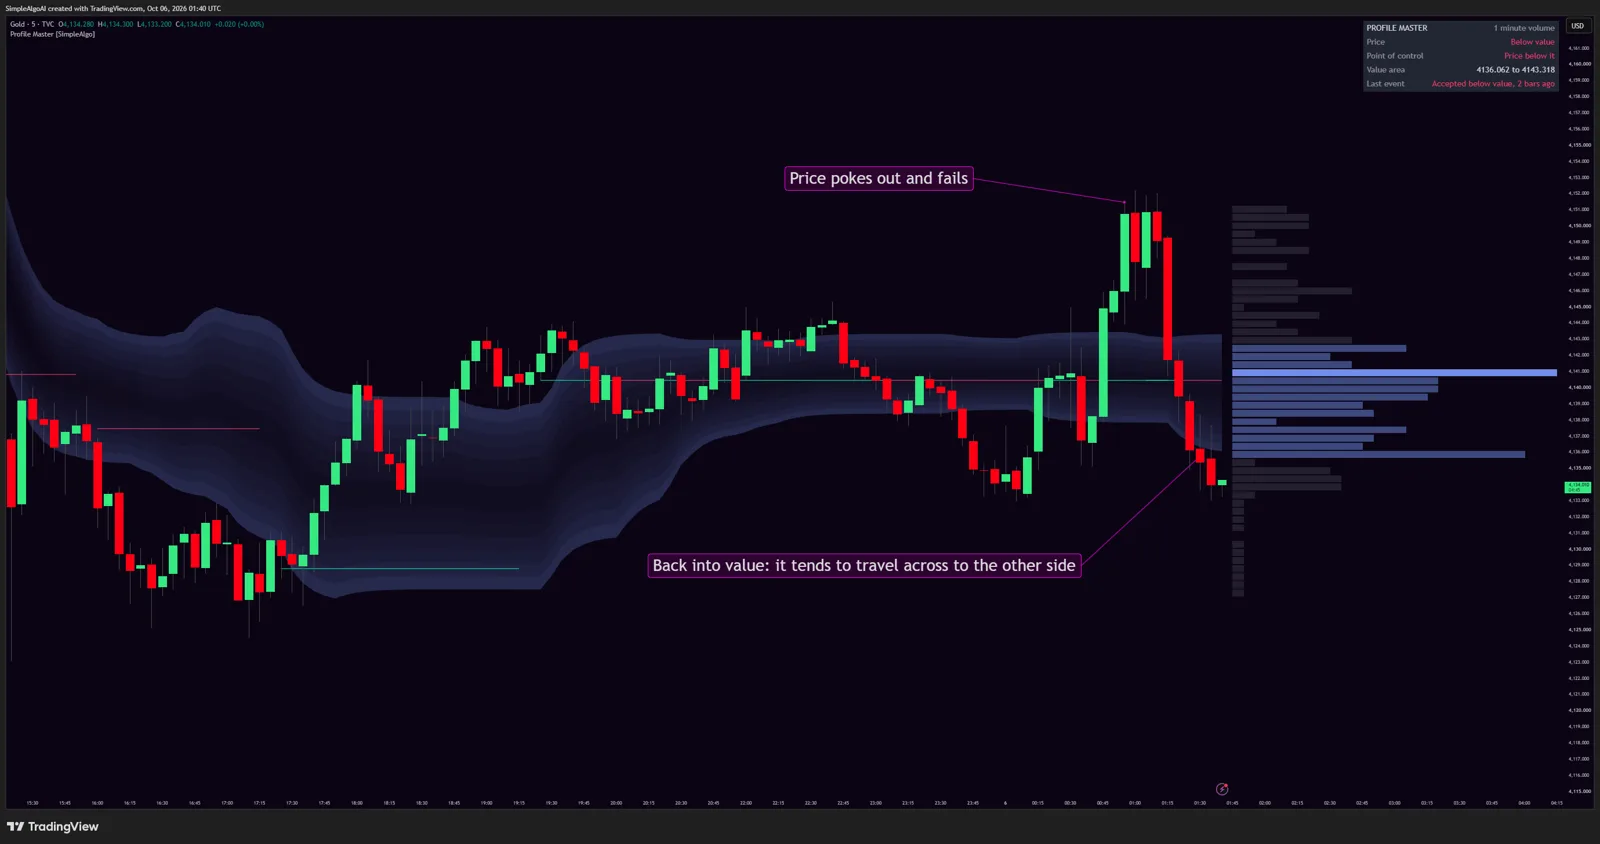
Accepted above or below value is the start of a move away from value, and the cloud will follow if the move holds. Back into value is the old market profile idea: when a market re-enters value and holds, it tends to rotate across the whole value area to the other side. It's a tendency, not a rule, and it works best after a failed attempt to leave, not during a trend that has already moved the cloud.
Timeframes
- 5 and 15 minute charts: the window is a few hours, and the cloud behaves like a session profile that never resets.
- 1 and 4 hour charts: the window covers days, and the cloud is where swing traders find their levels.
- Daily charts: a rolling four month profile with 1 hour volume inside it.
New to volume profiles?
The cloud is where most of the recent trading happened. Inside it the market is fair and chops between the edges; outside it the market is moving. The line is the price everyone agreed on the most. Two things are worth waiting for: price leaves the cloud and stays out, which means a move is starting, or price pokes out and comes back in, which means the move failed and price tends to travel back across the cloud.
How it works
1. Volume at price
For every chart bar the script reads the closes and volumes of a lower timeframe, picked automatically: 1 minute on charts up to 15 minutes, 5 minutes up to 1 hour, 15 minutes up to 4 hours, 1 hour up to daily, and 4 hours above that. Each lower timeframe close is sorted into one of eight price levels inside the bar. So a 1 hour candle isn't one block of volume smeared across its range: it's twelve 5 minute prints, each at the price where it happened.
If no lower timeframe data exists for a bar (including on a 1 minute chart), its volume is spread across the range with the body weighted three to one over the wicks. Two guards keep bad data out: a print more than three ATRs from the body is treated as a bad tick and counted at the edge of that range, and a single print is capped at ten times the bar's median print, so a closing auction shows as a busy row but can't own the profile.
2. The fading window
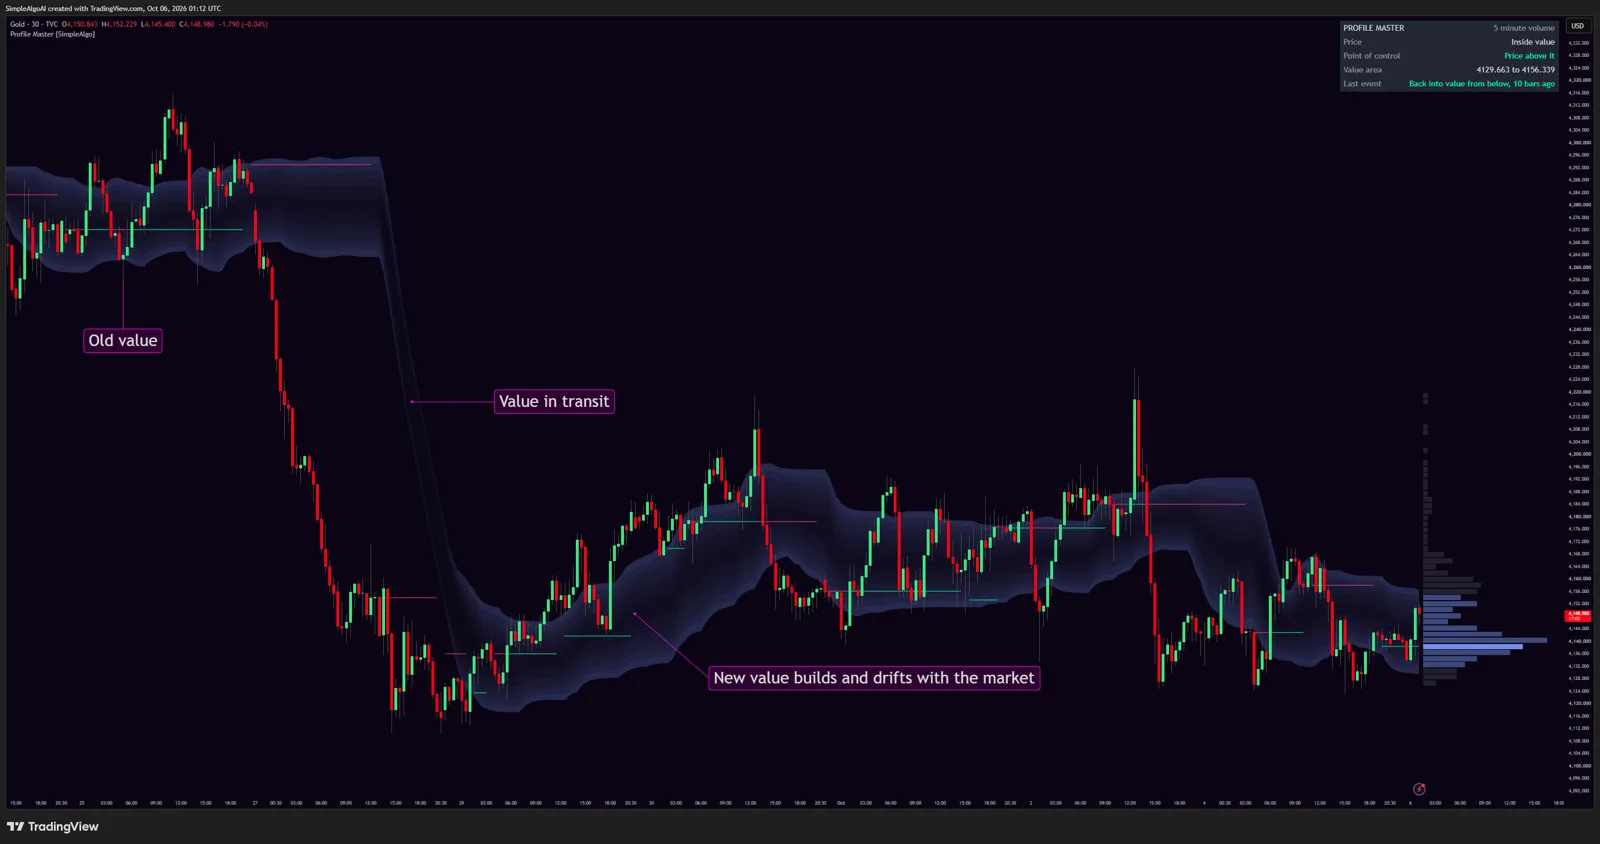
The profile is built from the last 90 bars, weighted by age. The newest bar counts in full, a bar halfway through the window counts for about a third, and the oldest bars count for almost nothing. A big session leaves the profile slowly, so the value area drifts instead of jumping.
3. The grid
The price range of the window is split into 48 rows. The range comes from where volume actually sat, not from every wick, so one spike doesn't coarsen the whole profile.
4. The point of control
The busiest row is read from a copy of the profile smoothed across three rows, so a busy area beats a single busy row. The control is sticky: the row that holds it keeps it unless another area carries clearly more volume, about a quarter more. Without that, the control would flip between two clusters on every bar.
5. The value area
The cloud is the value area of the cluster the control sits in, not of everything in the window. The cluster ends where the next two rows average less than 15% of the busiest row. From the control, the area grows one row at a time toward the side with more volume until it holds 70% of the cluster. Edges get a little hysteresis between the 66% and 74% areas so they don't twitch at the threshold.
This is why, after a fast move, the cloud doesn't turn into a tall slab spanning two clusters. It stays with the cluster that holds the control until the other one takes over, then travels there. The right-edge profile still shows both.
6. From rows to cloud
The raw edges go through a 5 bar median, then each edge can move only so far per bar: half an ATR by default, or a tenth of what's left of a long trip, whichever is more. A relocation of value draws a slope that eases into the new level instead of a wall. A short 4 bar smoothing rounds the corners, and while the edges are still more than half an ATR from where they're going, the cloud fades in proportion to the distance left.
7. The control line
The drawn level holds until the busiest row has moved a full row away. Only horizontal segments are drawn, levels that didn't last five bars are left out, and the colour needs two closes to flip. The last five bars are drawn live, so the right end of the line is provisional until they close.
Settings
Profile
| Setting | What it does | Default |
|---|---|---|
| Window (bars) | Bars of volume in the profile. Longer gives a slower, wider cloud; shorter hugs recent trading. | 90 |
| Fade older bars | Weights bars by age. Off gives a plain rolling profile where every bar counts the same. | On |
| Value area % | Share of the cluster's volume the cloud contains. 60 is a tighter core, 80 a wider one. | 70 |
| Rows | Price resolution of the profile. | 48 |
| Lower timeframe volume | Reads where volume traded inside each bar. Off spreads each bar's volume across its range. | On |
| Lower timeframe | Set by hand for coarser or finer prints. | Auto |
| Cloud smoothing | Smoothing on the edges after the median. Higher is rounder and later. | 4 |
| Cloud speed limit | Furthest an edge can move in one bar. Raise it if you'd rather the cloud move faster. | 0.5 ATR |
| History (bars) | How far back the cloud is drawn. Keeps the script quick on long charts. | 2,000 |
Events
| Setting | What it does | Default |
|---|---|---|
| Bars to confirm | Closes needed on the other side of the cloud before an event counts. | 2 |
| Mark events on the chart | Small dots where price comes back into value and small triangles where it's accepted outside. The panel and alerts report events either way. | Off |
Look
| Setting | What it does | Default |
|---|---|---|
| Theme | Neon, Classic, Aurora, Ice, or Custom with your own cloud, up and down colours. | Neon |
| Cloud strength | 1 to 5. Lighter or heavier fill for your screen and background. | |
| Point of control line | Show or hide the control segments. | |
| Profile at the right edge | Show or hide the histogram, and set its width in bars. | |
| Panel | Position and size. |
Alerts
- 1Click Alert in TradingView
- 2Choose Profile Master
- 3Pick an eventAccepted above value, Accepted below value, Back into value from above, or Back into value from below.
- 4Set "Once per bar close"Events are only ever confirmed on a closed bar.
- 5Create
Notes and limits
- Volume is whatever your data feed gives. On forex and CFDs that's tick volume, which still clusters where trading is busy.
- Symbols with no volume use time at price instead, and the panel says so.
- Deep in the history, lower timeframe data runs out and the cloud is a little coarser.
- After a gap or fast move the cloud stays at the old levels for a while, then travels at the speed limit. The panel saying price is above or below value in that window is correct.
- In a steady trend with no pauses the cloud gets tall, because no price has been agreed yet.
- When the window holds two clusters, the value area is narrower than a classic profile's, because it covers only the cluster the control sits in.
Common questions
Yes. It's free and open source on TradingView. You don't need a SimpleAlgo membership to use it.
Every bar of the cloud is built only from the bars before it, so the historical cloud doesn't change. The cloud and the control update on the live bar like a moving average does. Events are decided on closed bars and never move afterwards.
No. Events describe where price is relative to value. The cloud is a map of where volume has been, not where price is going. Use it with your own analysis and risk plan.
Value can move to meet price. When price sits at one level long enough, the cloud arrives there. Events only count when price did the moving, so the panel's Last event row says Value caught up to price instead.
In a steady trend with no pauses, trading is spread over the whole move and there's no thin stretch to end the cluster. A tall cloud is itself a read: nobody has agreed on a price yet.
Yes. There, volume is tick volume, the count of price changes, not contracts. Tick volume still clusters where trading is busy, so the profile works, but it isn't the same as futures or stock volume.
The profile is built from time at price, one count per lower timeframe bar, and the panel says so.
TradingView limits how far back lower timeframe data goes. Deep in the history the script spreads each bar's volume across its range instead.
All of them. The lower timeframe used for volume is picked automatically for your chart, or you can set it by hand.