RSI Master
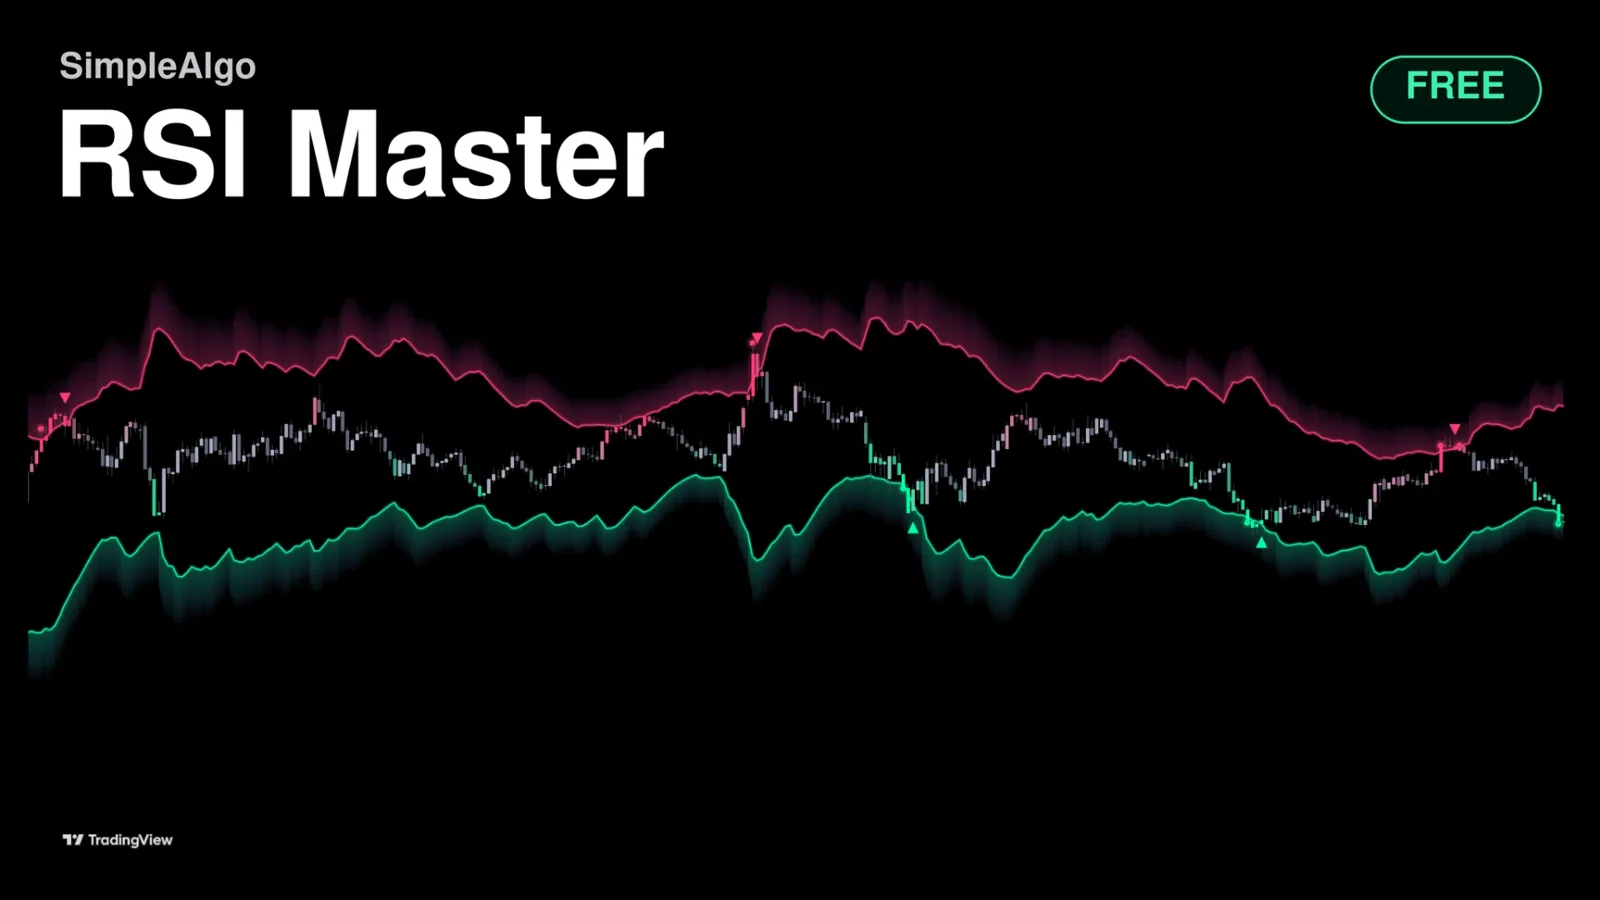
RSI tells you a number. It doesn't tell you a price. RSI Master runs the RSI formula backwards every bar and draws the exact closes that would put RSI at 70 and at 30 as two zones on your chart, so you can see how much room price has left.
Getting started
- 1Open TradingView and click IndicatorsSearch for "RSI Master SimpleAlgo" in the Community scripts tab.
- 2Add RSI Master to your chart
- 3Keep the defaultsRSI length 14 with levels at 70 and 30, the same as a standard RSI pane. The zone edges are smoothed over 3 bars.
- 4Add alerts if you want themSet them to "Once per bar close".
What you see on the chart
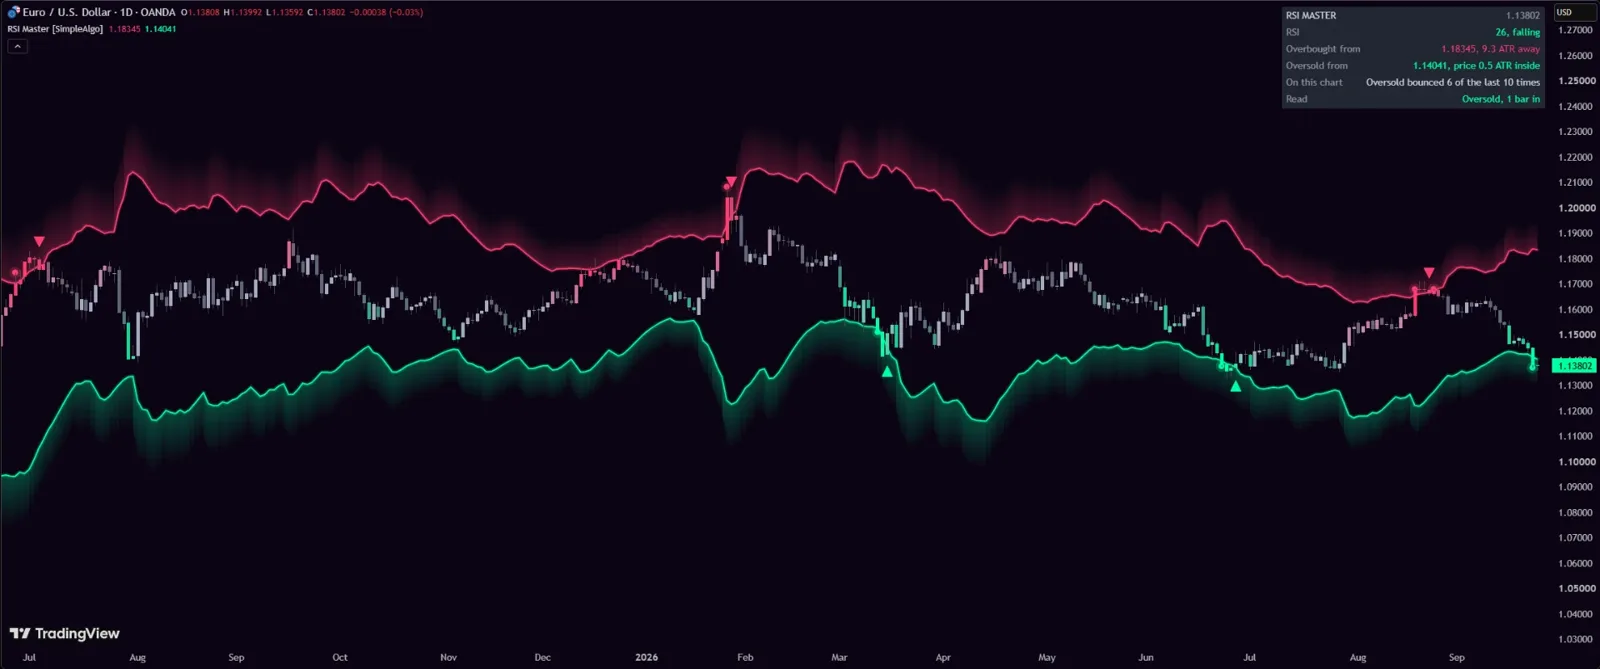
- The pink line is where overbought begins and the mint line is where oversold begins, in price, right now.
- Each zone is full at its edge and fades away from price over about two ATRs. The fade is only drawing: overbought carries on upward past the glow.
- Grey candles are the middle of the range. They warm toward pink as RSI climbs and cool toward mint as it falls, and are fully lit once price is inside a zone.
- A dot marks the first close into a zone. A small arrow marks the exit, down out of overbought and up out of oversold.
How it works
RSI
RSI is the standard Wilder RSI, 14 bars by default, with the same smoothing every charting platform uses, so the number matches the RSI in your pane.
The price behind a level
RSI on the next bar depends on today's averages and one unknown: the next move. So for any level, the formula can be solved for the move that gets there. Run it for 70 and you have the overbought edge; run it for 30 and you have the oversold edge. A short average keeps the edges calm without hiding the moves that matter.
In and out
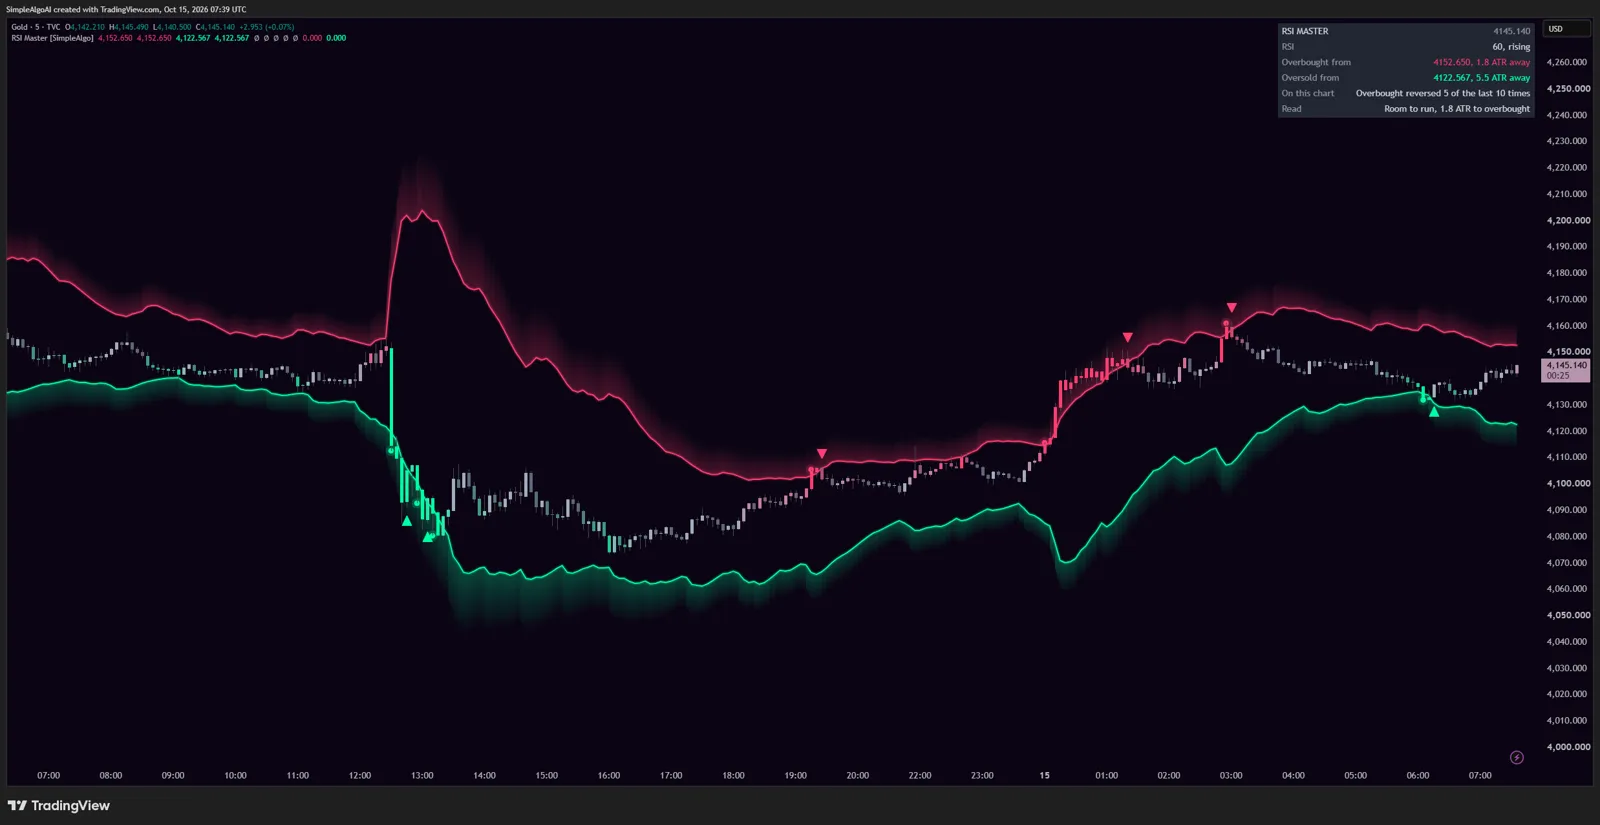
Price is in a zone when RSI is at or past the level. The first bar in gets a dot and the first bar out gets an arrow. When price flickers in and out over a few bars, only the first exit gets an arrow, so a choppy edge doesn't turn into a row of them.
The record
Overbought means different things on different charts. So each zone entry is judged by what price did next, measured from the entry close: a full ATR against the zone first counts as reversed, a full ATR with it first counts as followed through, and an entry that does neither within ten bars is dropped rather than guessed. The last ten for each zone are kept, and the panel shows the record for the nearer zone. It describes the chart you're looking at; it doesn't predict the next visit.
The panel
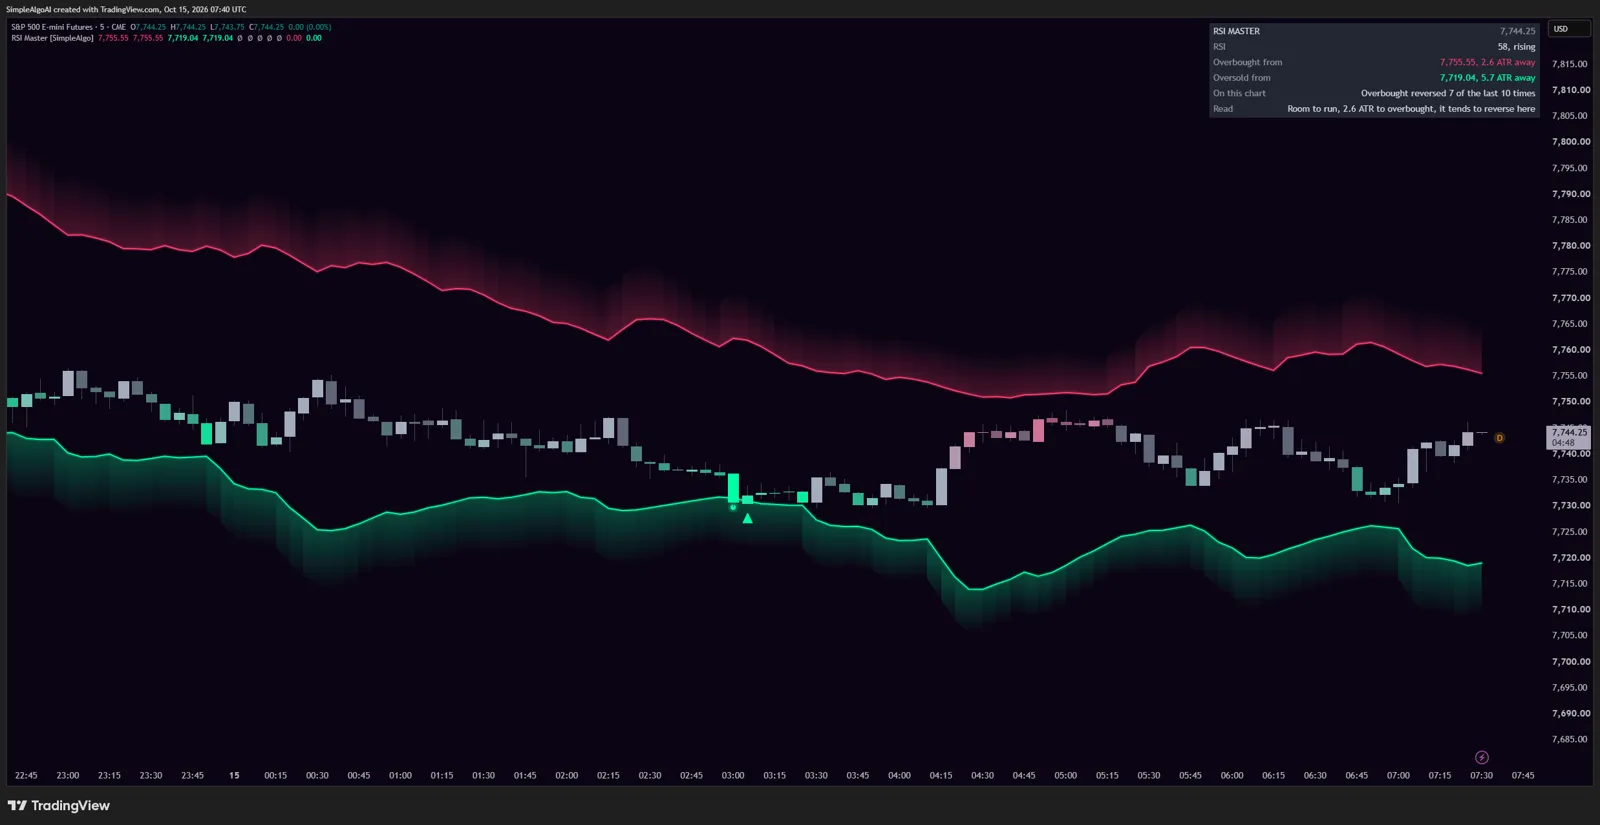
| Row | What it shows |
|---|---|
| RSI | The value, and whether it's rising, falling or flat over the last three bars. |
| Overbought from | The price the overbought zone starts at, and how far away it is in ATRs, or how deep inside it price already is. |
| Oversold from | The same for oversold. |
| On this chart | The record for the nearer zone, out of the last ten entries. |
| Read | One line, such as Room to run, Knocking on overbought, Overbought, 3 bars in, or Left oversold 2 bars ago, with the chart's tendency added when the record is lopsided. |
Alerts
- Overbought: price closed into the overbought zone
- Left overbought: price left it
- Oversold: price closed into the oversold zone
- Left oversold: price left it
Set them to Once per bar close. A zone entry on a live bar can still be undone before the close.
Settings
| Setting | What it does |
|---|---|
| Length | RSI length. 14 by default, the same as your pane. |
| Overbought / Oversold | 70 and 30 by default. Move them and the zones move with them. |
| Smoothing (bars) | How calm the zone edges are. 3 by default. Lower is more exact and more jagged; higher is smoother and a bar or two behind. |
| Theme | Neon, Classic, Aurora, Ice, or Custom with your own colours. |
| Brightness | 1 to 5, for your screen and background. |
| Zone depth (ATR) | How far the glow reaches past each edge. Drawing only. |
| RSI candles | On by default. Turn off to keep your own candle colours. |
| Midline (RSI 50) | The price that would put RSI exactly at 50, as a dotted line. Off by default. |
How to read it
- 1Read the distance firstHow many ATRs to overbought or oversold. A trade with room before momentum is stretched is a different trade from one a candle away from the zone.
- 2Then the zoneInside the overbought zone is overbought by the exact definition you already use. Whether that means anything for a trade depends on the chart.
- 3Then the recordIt shows what reaching that zone led to on this chart recently. Read the count next to it, and use it alongside the rest of your analysis.
- 4The arrowThe exit from a zone is the oldest RSI signal: momentum stretched, then let go. It describes what just happened, not what to do.
Timeframes
Nothing is tied to a timeframe. On a 5 minute chart the zones are a few points away and price visits them several times a session; on a daily chart they can be far away and visits are weeks apart.
Common questions
Yes. It's free and open source on TradingView, no membership needed.
RSI changes while a bar is open, so on the live bar the edges, candle colour and a fresh entry or exit can move until the close, and the panel says confirms on close. Once a bar closes nothing about it changes, and the record is only written on closed bars.
Yes. It uses the standard 14-bar Wilder RSI with the same smoothing as TradingView's built-in RSI.
No. It marks price leaving a zone. Combine it with the record and your own analysis, and manage your risk.