MACD Master
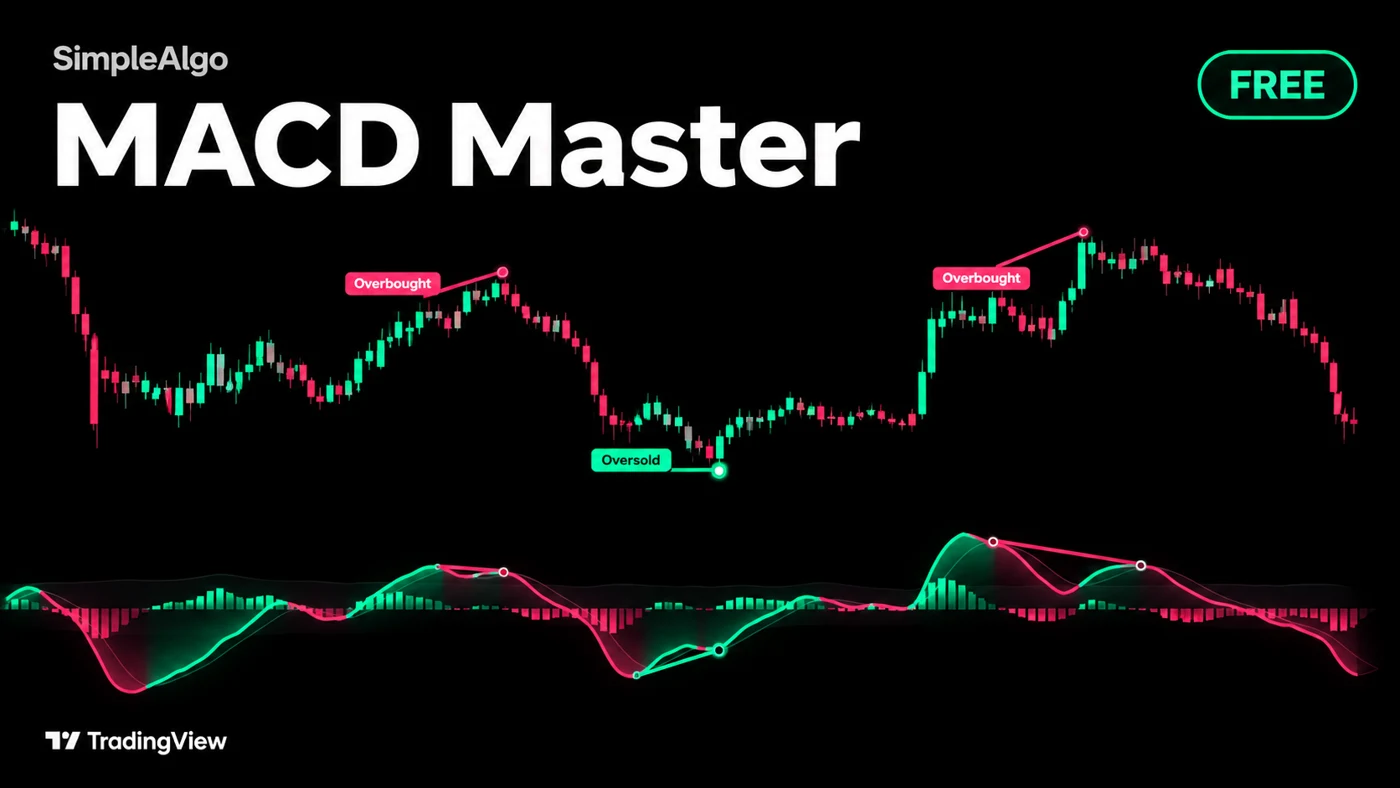
What changed in momentum, and which close would produce the next cross? MACD Master keeps the classic MACD and adds filtered signals, divergences, the exact cross price and a clock that answers what happens if price stays here.
Getting started
- 1Open TradingView and click IndicatorsSearch for "MACD Master SimpleAlgo" in the Community scripts tab.
- 2Add MACD Master to your chart
- 3Keep the defaultsKeep Fast length 12, Slow length 26 and Signal length 9. The grey band is 0.5 ATR on each side of zero. MACD opens in a separate pane, while signals and the next cross price appear on the price chart.
- 4Add alerts if you want themSet them to "Once per bar close".
What you see
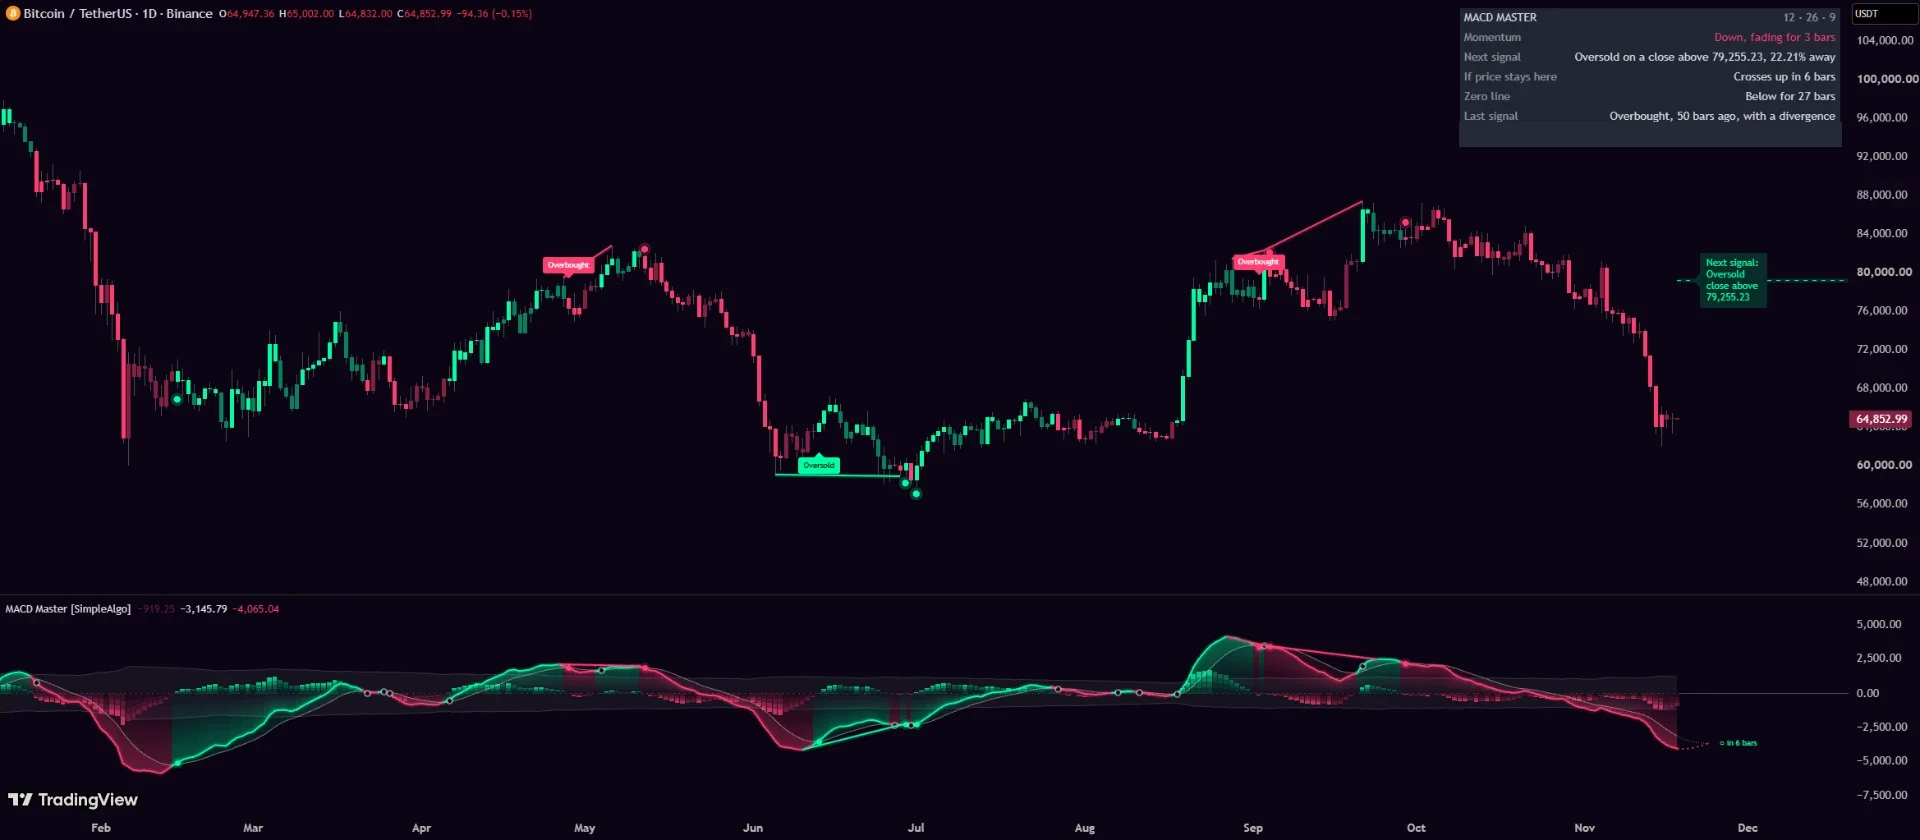
- MACD line, signal line and histogram in a separate pane, with a grey band around zero.
- Four histogram states: up and building, up and fading, down and building, down and fading. Bright means building; dim means fading. Optional candle colours match.
- Solid dots in the pane for filtered signals, hollow rings for other crosses. The price chart uses Oversold and Overbought labels, Buy and Sell, or dots.
- A dashed next cross price on the chart and dotted clock projections in the pane.
- Divergence lines on both price and MACD, plus a plain-language panel.
The classic calculation
MACD is the fast EMA of close minus the slow EMA of close. The signal is an EMA of MACD, and the histogram is MACD minus signal. Defaults are 12, 26 and 9. The shorter entered length becomes the fast length; equal fast and slow inputs make the slow one one bar longer.
The grey band uses ATR over the slow length, multiplied by Band width on each side of zero. It scales the signal filter to the chart's volatility, without changing the MACD calculation.
Which crosses become signals
- Signal up: MACD crosses above its signal line, and the previous candle's signal line was below the lower band.
- Signal down: MACD crosses below its signal line, and the previous candle's signal line was above the upper band.
- Other crosses remain visible as hollow rings in the pane.
- Signals confirm only when the candle closes. Repeated signals in the same direction become dots until an opposite signal arrives.
The next cross price
The dashed line is the close that would put MACD exactly on its signal line. It is solved from the EMA formula, not estimated from a trend line. During a forming candle it is the threshold for that candle; after the close it is recalculated for the next one.
A close above the threshold leaves MACD above signal, and a close below leaves it below. Equality means they meet. The label reads Next signal when the corresponding cross also meets the band rule. A wick reaching the line does not confirm a signal.
Divergences
A wave is the stretch MACD spends on one side of its signal line. Each completed down wave has a lowest MACD value and a lowest price low. A lower price low with a higher MACD low than the preceding down wave is bullish divergence. The up-wave mirror is bearish divergence: a higher price high with a lower MACD high.
Lines join the extremes of the two waves, but only appear when the ending cross candle closes. They are drawn back to those extremes then, not known at the earlier extreme, and are never redrawn afterwards. TradingView drawing limits can remove the oldest lines.
The cross clock and panel
The clock carries both lines forward as if every coming candle closed at the latest price, looking up to 20 bars ahead. Zero means the current candle would cross if it closed here. No cross within 20 bars is not a promise that no cross will happen: changing price changes the answer.
| Panel row | Meaning |
|---|---|
| Momentum | Direction, building or fading, and how many bars that state has lasted. |
| Next cross / Next signal | Required closing price and which direction the cross would take. |
| If price stays here | Conditional bars to the cross; hidden when Cross clock is off. |
| Zero line | Which side of zero MACD occupies and how long it has been there. |
| Last signal | Direction, age and whether a divergence accompanied it. |
| Signals | A historical comparison of how often signals and other crosses were undone by an opposite cross within five bars. It needs at least 20 of each kind and is not a trade-outcome or profitability measure. |
Settings
| Setting | What it does | Default |
|---|---|---|
| Fast length | Fast EMA length, from 2 to 500. | 12 |
| Slow length | Slow EMA length, from 3 to 1000. | 26 |
| Signal length | EMA smoothing of MACD, from 2 to 500. | 9 |
| Signals on the chart / Label style | Show chart signals and choose Overbought and Oversold, Buy and Sell, or Dots. | On / Overbought and Oversold |
| Band width | ATRs on each side of zero, from 0 to 5. Wider filters more crosses; zero removes the band but keeps the toward-zero rule. | 0.5 |
| Divergences | Show wave-to-wave divergence lines on price and MACD. | On |
| Next cross price | Show the exact closing threshold on the price chart. | On |
| Cross clock | Show the conditional projection and its panel row. | On |
| Colour the candles | Match price candles to the four histogram states. | On |
| Glow under the MACD line | Show or hide the pane's fill under MACD. | On |
| Colours | Mint and Pink, Ice, Neon or Custom, with your own up and down colours. | Mint and Pink |
| Text size | Small, Normal or Large labels and panel text. | Normal |
| Panel / Position | Auto uses the top right of price and moves down when visible price is near the top. Or choose any corner. | On / Auto |
Alerts
- Signal up (Oversold, Buy)
- Signal down (Overbought, Sell)
- MACD crossed up (any cross)
- MACD crossed down (any cross)
- Bullish divergence
- Bearish divergence
- Price reached the next cross price
- MACD above zero
- MACD below zero
- Momentum started fading
Use Once per bar close for confirmed readings. The price-reached condition detects a touch of the threshold, not a confirmed cross. Some unfiltered conditions can change during a live candle; the signal and divergence conditions require the closing candle.
Notes and limits
- MACD is based on moving averages and lags price. Ranging markets can produce repeated crosses.
- The live MACD, histogram, candle colours and clock change until the bar closes. Confirmed signals stay on their candle.
- Divergence is known only at the ending cross, even though its lines connect earlier extremes.
- The next cross price is a one-candle threshold, not support, resistance or a target.
- The clock assumes unchanged closing prices. It does not predict when a market will turn.
Common questions
Yes. It is free and open source on TradingView, with no SimpleAlgo membership required.
Yes. The defaults use 12 and 26 EMAs of close, with a 9 EMA signal line.
Signals confirm on closing candles and are not moved or removed. Divergence lines appear at the ending cross and join earlier wave extremes. Live values and the conditional tools update with price; they are not confirmed signals.
No. It calculates when the lines would meet if each coming candle closed at the latest price, up to 20 bars ahead.
Only crosses toward zero from outside the grey band qualify. Other crosses are hollow rings, and repeated same-direction signals are dots.