Reversal Master
Reversal Master shows when a move has stretched too far, and when the pressure behind it starts to let go. Three layers work together: reversal bands, reversal signals and trend candles. Every label has a tooltip in plain language.
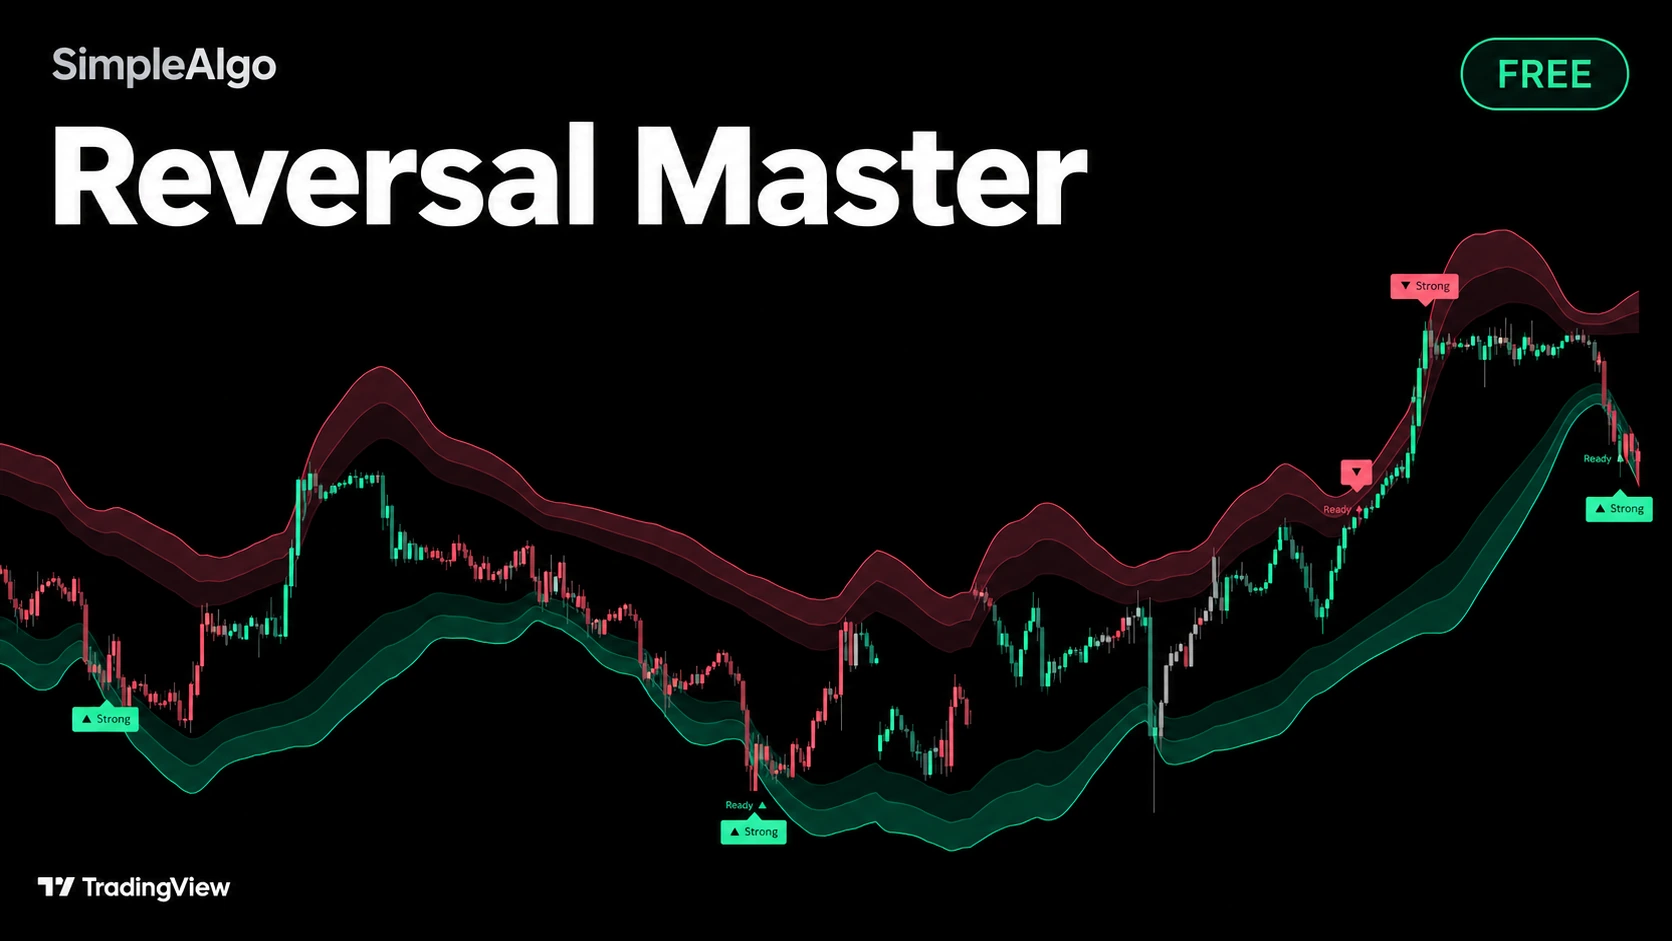
- Reversal bands that show when price is stretched too far
- How it waits for momentum to actually flip before marking a turn
- Why stretched is not the same as reversing
- How to add it to TradingView for free
Getting started
- 1Open TradingView and click IndicatorsSearch for "Reversal Master SimpleAlgo" in the Community scripts tab.
- 2Add Reversal Master to your chart
- 3Keep the defaultsDefaults suit intraday and swing charts. Very short timeframes may want longer momentum smoothing.
- 4Add alerts if you want themSet them to "Once per bar close".
What you see on the chart
- Reversal bands: three tiers above and below price showing how far it has stretched from normal.
- Ready tags: momentum has entered an extreme. Nothing has turned yet.
- Reversal signals: a ▲ or ▼ when momentum leaves an extreme, marked Strong when price reached the outer bands during the move.
- Trend candles: coloured by the angle of the trend, fading to grey in flat markets.
How it works
Bands
The centre is an exponential average of typical price. Band distance is measured in a volatility unit blending standard deviation and ATR, lightly smoothed. The first band sits at the chosen distance, the second 0.75 units further, the third 1.5 units further.
Momentum
Signals use the Relative Volatility Index, from 0 to 100. Above the high level (80) upside pressure is stretched; below the low level (20) downside pressure is.
Ready and signal
When momentum enters an extreme, a Ready tag appears and the script tracks how far price reaches into the bands. When momentum leaves the extreme, a ▼ (from the high side) or ▲ (from the low side) prints. If price reached at least the second tier while momentum was extreme, it's marked Strong.
Trend candles
The slope of a linear regression line is measured in ATR and converted to an angle. Steeper up shades candles toward the up colour, steeper down toward the down colour, flat fades to grey. Down candles inside a trend use a darker shade so candle direction stays visible.
How to use it
- Read the stretch first. Price in the outer tiers means the move is extended. That's context, not a signal on its own.
- Ready means watch. Momentum is at an extreme, but nothing has turned.
- The signal is the turn. Strong signals came after a bigger stretch and are the ones most traders focus on.
- Use the candles for the bigger picture. Counter-trend signals against a steep candle colour deserve more caution than signals once candles have faded to grey.
- Shorter momentum settings react faster and print more often. A larger band distance makes Strong rarer.
Settings
| Setting | What it does | Default |
|---|---|---|
| Reversal signals / Ready tags | Show or hide each. | On |
| Momentum length and smoothing | Shorter reacts faster and prints more often. | |
| Extreme levels | Where momentum counts as stretched. | 80 / 20 |
| Signal and Ready spacing | Minimum bars between signals and between Ready tags. | |
| Reversal bands | Show or hide, length and distance. | |
| Trend candles | Show or hide, and angle length. | |
| Colours | Up, down and flat colours. |
Alerts
- Buy-side reversal and Sell-side reversal, on bar close, with Strong noted in the message.
- Ready: buy side and Ready: sell side.
Set alerts to "Once per bar close".
Common questions
Yes. It's free and open source on TradingView, no membership needed.
Signals and Ready tags are decided on bar close and don't move. Bands and candle colours update on the live bar like any moving average.
Price reached at least the second band tier while momentum was at an extreme.
Any. Defaults were chosen for intraday and swing charts.