Fibonacci Master
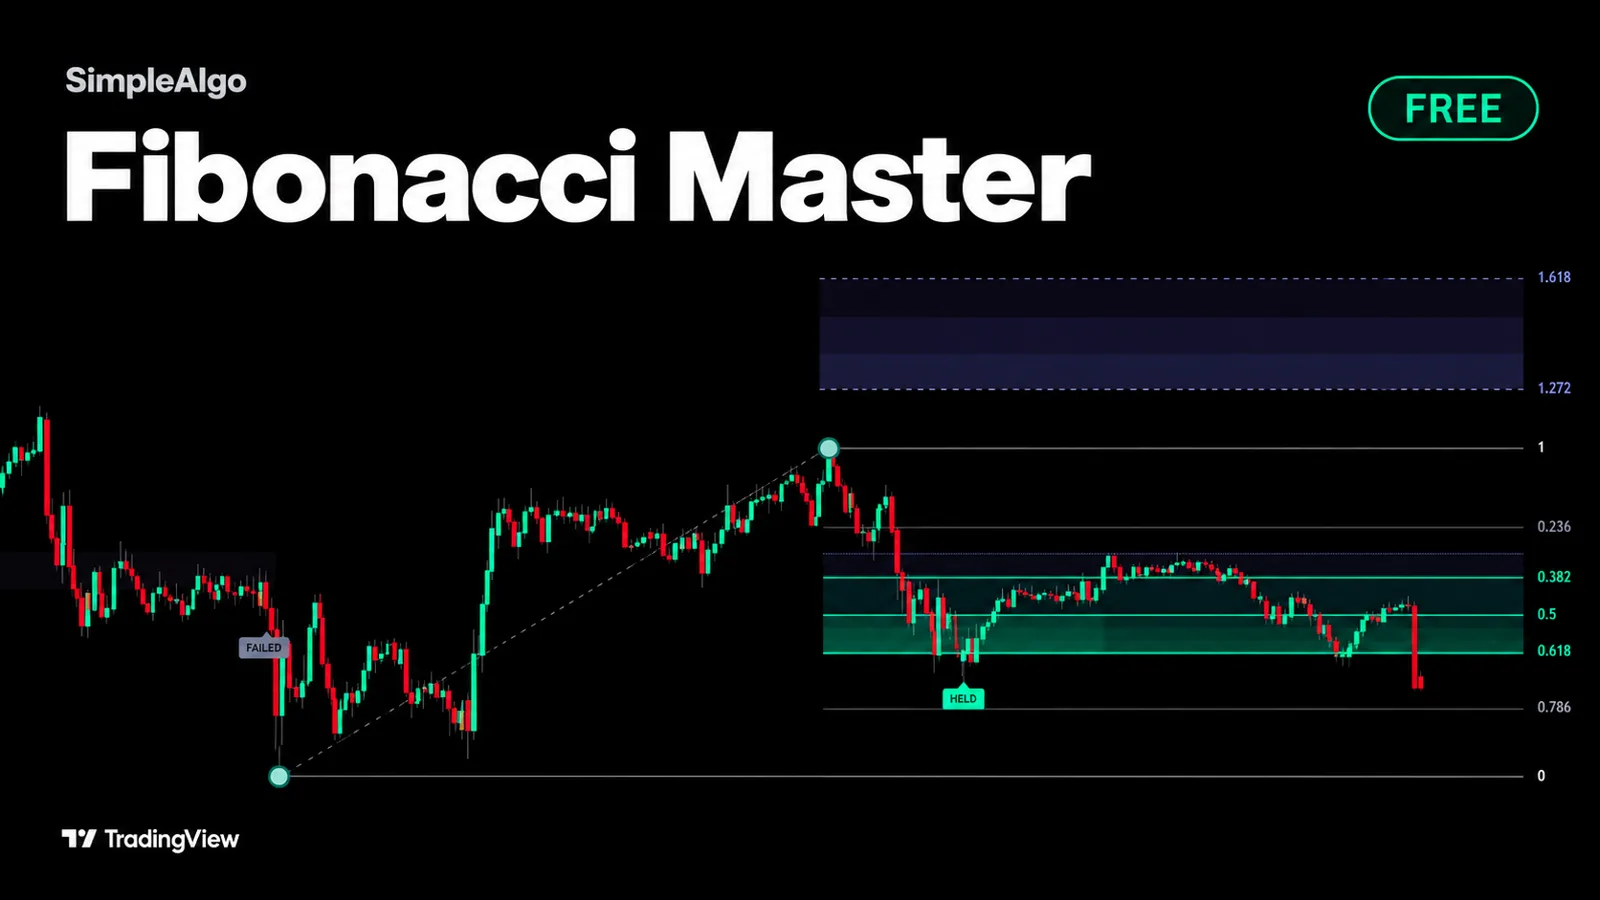
The Fibonacci retracement, drawn for you and kept honest. Fibonacci Master finds the swing that matters, draws the levels from it, lights up the 0.5 to 0.618 zone and projects the 1.272 and 1.618 targets. Then it measures where pullbacks actually end on your chart, instead of assuming.
Getting started
- 1Open TradingView and click IndicatorsSearch for "Fibonacci Master SimpleAlgo" in the Community scripts tab.
- 2Add Fibonacci Master to your chart
- 3Keep the defaultsA swing has to be at least 4 ATRs tall before levels appear. Targets, the pullback band, tags and the panel are all on.
- 4Add alerts if you want themSet them to "Once per bar close".
What you see on the chart
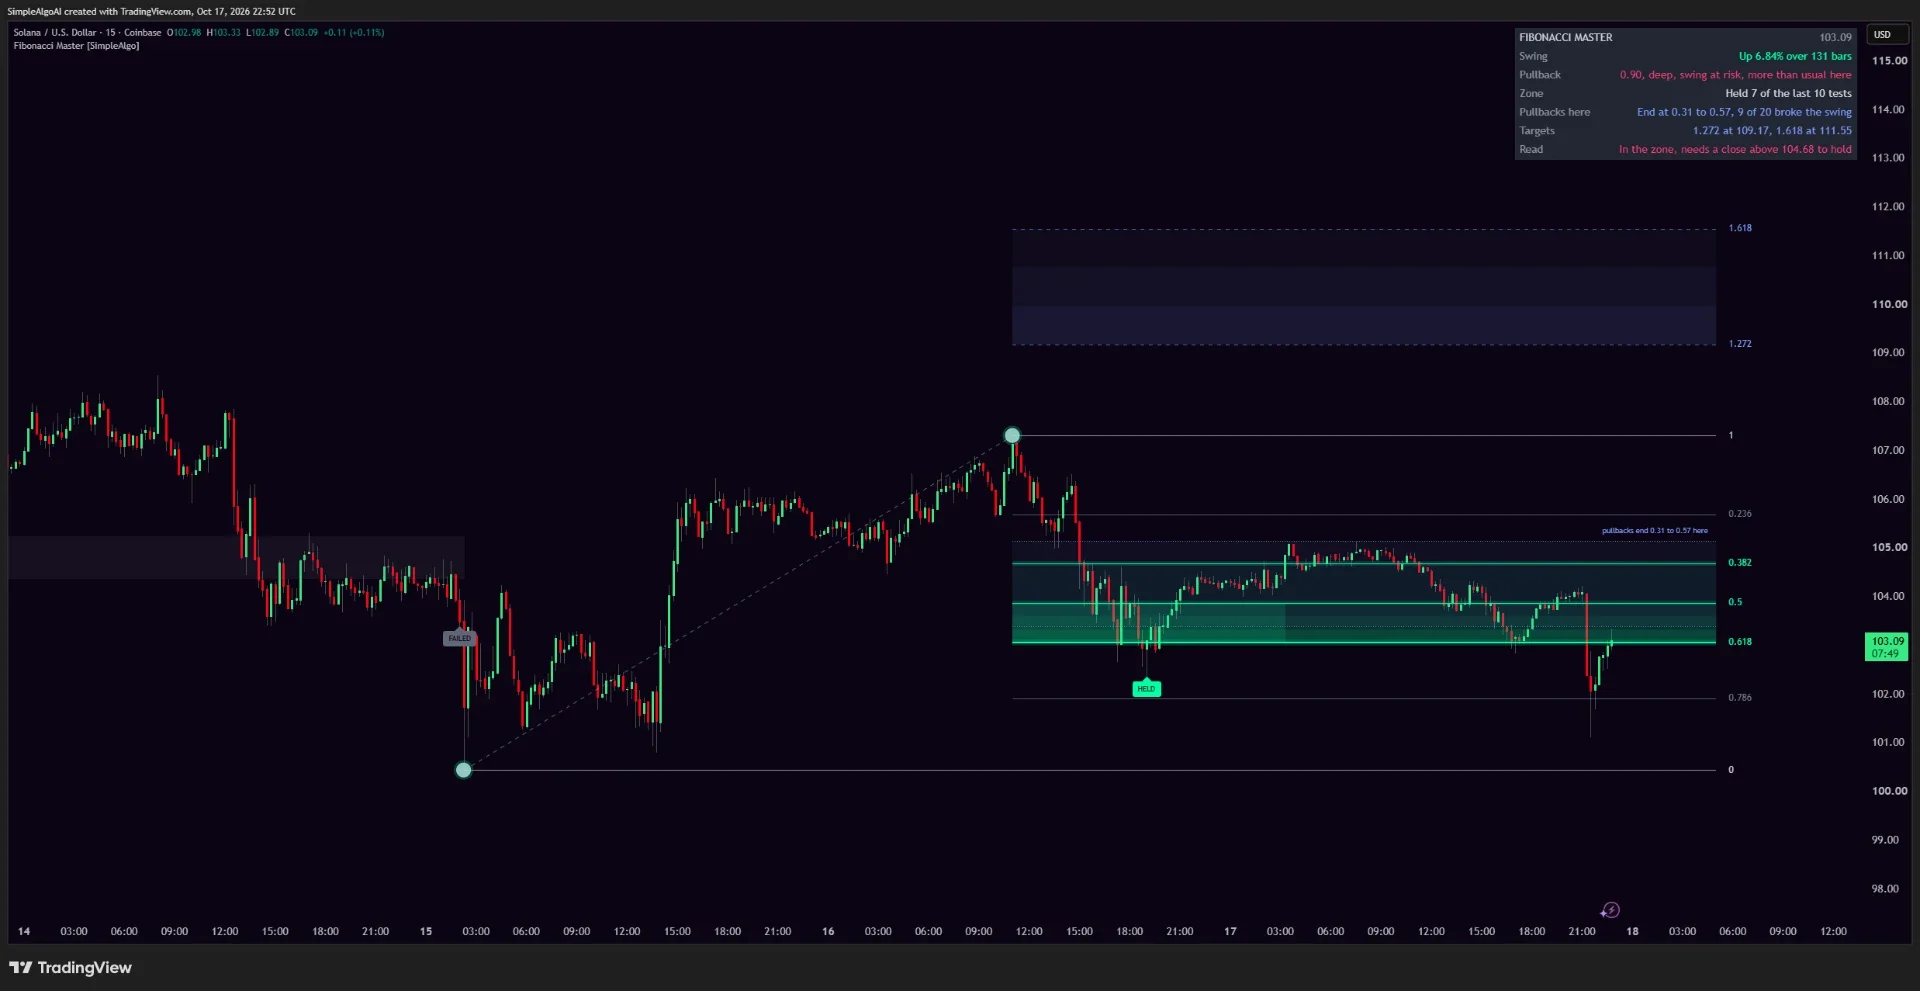
- Two dots mark the start and end of the current swing, joined by a dashed swing line.
- Levels run from 0 at the swing start to 1 at the swing end, with 0.236, 0.382, 0.5, 0.618 and 0.786 in between.
- The 0.5 to 0.618 zone is lit. That's where pullbacks are classically supposed to end.
- The 1.272 and 1.618 targets sit beyond the swing in a shaded box.
- A dotted band, labelled with where pullbacks end here, shows where pullbacks have actually ended on this chart.
- HELD and FAILED tags mark each judged test of the zone, and a faint box stays where each judged zone sat.
How it works
The swing
A move counts as a swing once it's at least the Swing size setting tall, measured in ATRs (4 by default). When a pullback that deep is followed by a new high (or a new low in a down swing), a fresh swing starts from the pullback; smaller dips just extend the swing. A close past 0.786 means the pullback has become the swing, so it flips the other way. Until a swing is tall enough, the panel shows the swing forming and how many ATRs it has so far.
Tests of the zone
Every pullback into the 0.5 to 0.618 zone is a test, judged on closes, not wicks. A close back past 0.382 means it HELD. A close past 0.786 means it FAILED. Each test is tagged, boxed and counted, and the panel shows how many of the last ten held.
Locking and targets
A hold locks the swing, so the levels and targets stay put while price works toward them. Whether 1.272 was reached after each hold is counted too. The lock is released when price reaches 1.618, loses the pullback low, or pulls back again and makes a new extreme, and the swing then restarts from the low that held.
Where pullbacks end here
Every pullback is recorded as a fraction of its swing. The band runs from the 25th to the 75th percentile of the last twenty, so it covers the middle half of where they ended. Pullbacks that broke the swing are counted separately and kept out of the band. It describes the chart you're looking at; it doesn't predict the next pullback.
The panel
| Row | What it shows |
|---|---|
| Swing | Direction, size in percent and how many bars it took, or how far a new swing has formed. |
| Pullback | How deep the current pullback is as a fraction of the swing, from shallow to past the zone. |
| Zone | How many of the last ten tests held. |
| Pullbacks here | The band where pullbacks end on this chart, and how many of the last twenty broke the swing. |
| Targets | The 1.272 and 1.618 prices. |
| Read | One line, such as In the zone, needs a close above 104.68 to hold, or Zone held, next target 1.272. |
Alerts
- In the zone: price pulled into the 0.5 to 0.618 zone
- Zone held: the pullback to the zone held
- Zone failed: the pullback to the zone failed
- 1.272 hit: price reached the 1.272 target
- 1.618 hit: price reached the 1.618 target
- New swing: the swing flipped
Set them to Once per bar close. A test on a live bar can still change before the close.
Settings
| Setting | What it does |
|---|---|
| Swing size (ATR) | The smallest move that counts as a swing, 4 ATRs by default. Raise it for bigger swings, lower it for smaller ones. |
| Theme | Neon, Classic, Aurora, Ice or Custom, with your own up and down swing colours. |
| Brightness | How strongly the zone and boxes are filled, 1 to 5. |
| Targets (1.272, 1.618) | Show or hide the targets beyond the swing. |
| Where pullbacks end here | Show or hide the dotted band. |
| Swing line and past zones | Show or hide the dashed swing line and the faint boxes of judged zones. |
| HELD / FAILED tags and level labels | Show or hide the tags and the level numbers. |
| Extend right (bars) | How far the levels reach past the last bar, 25 by default. |
| Panel | Show or hide it, choose a corner and a size. |
How to read it
- 1Start with the swingNo swing, no levels. The panel tells you how close a new one is.
- 2Watch the pullbackThe Pullback row tells you how deep it is and whether it's reached the zone.
- 3Compare the zone with the bandThe zone is the classic answer. The band is what this chart has actually done. Read both.
- 4Let the close decideA test isn't held or failed until a bar closes past 0.382 or 0.786.
Common questions
Yes. It's free and open source on TradingView, no membership needed.
No. It finds the swing automatically, sized in ATRs, and redraws the levels when a new swing starts.
While a bar is open, the pullback depth and a fresh test can change until the close. Tests are judged on closes, and once a bar closes nothing about it changes. A new swing can replace the levels, which is how any automatic Fibonacci works.
No. It marks a pullback that closed back past 0.382 after testing the zone. Combine it with your own analysis, and manage your risk.