Stream Master
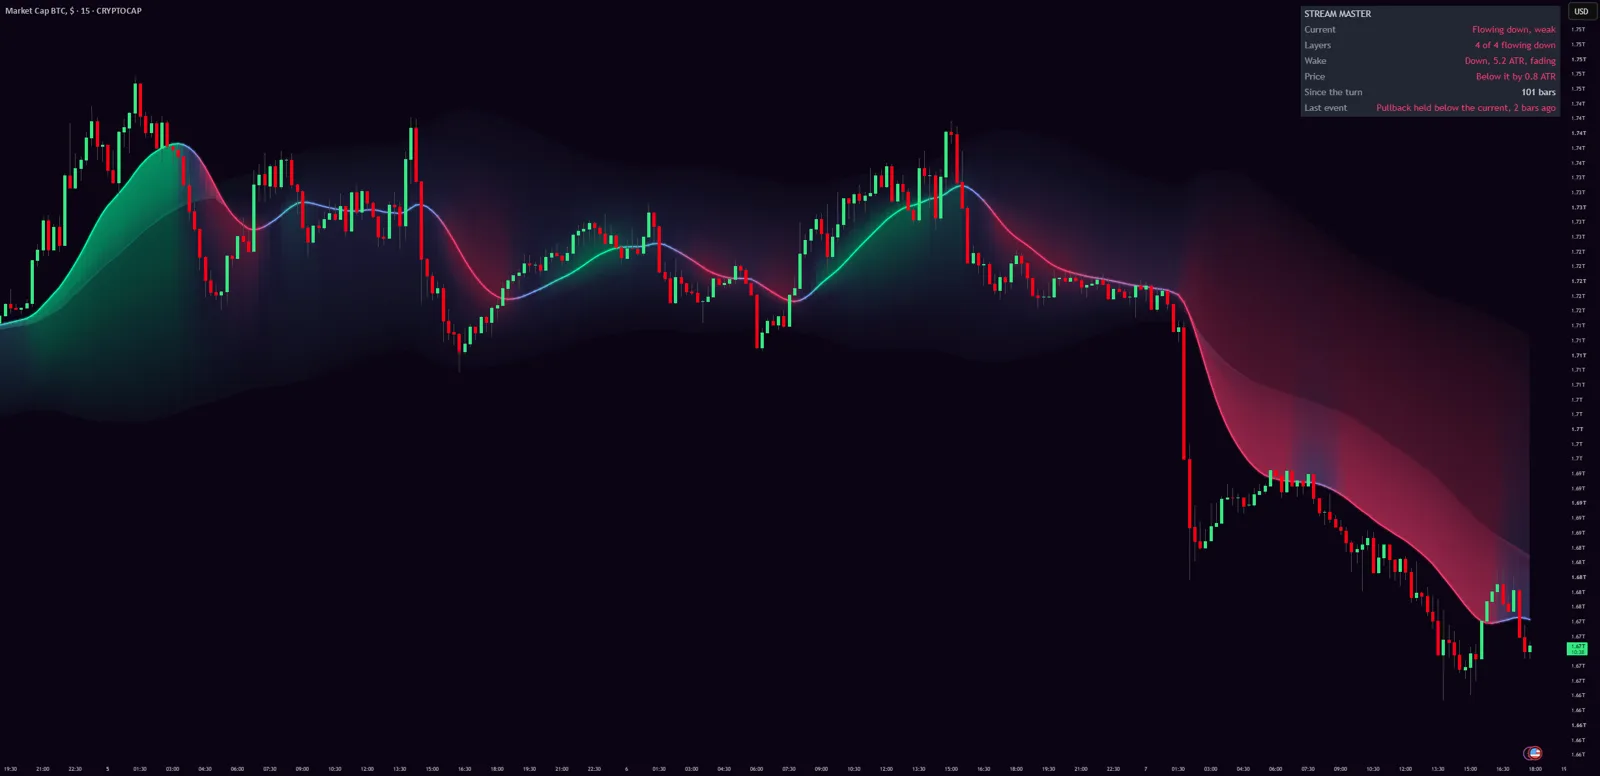
Which way is the market flowing, how hard, how deep has a turn gone, and how long has the move run? Stream Master draws trend as a river. The colour and shape of the water is the whole read, and the panel in the corner says it in words.
Getting started
- 1Open TradingView and click IndicatorsSearch for "Stream Master SimpleAlgo" in the Community scripts tab.
- 2Add Stream Master to your chart
- 3Keep the defaultsThe current responds over about 10 bars and the slow water over about 60. Everything is measured in ATRs, so the defaults work on gold, crypto and stocks alike.
- 4Add alerts if you want themSet them to "Once per bar close".
What you see on the chart
- The current: price smoothed twice over 10 bars. It's the quickest read of direction.
- Three edges around it. The first sits about half way between the current and the slow water, the second most of the way, and the third is the slow water itself (price smoothed twice over 60 bars).
- Each edge is pushed out by 35%, 70% and 100% of the river's width, 3.5 ATRs each side by default.
- Mint water is flowing up, pink is flowing down, blue is slack. The water is brightest at the current and fades toward the slow water, and the whole river dims when nothing is moving.
- No labels. The panel and the alerts carry the words.
How the river works
The flow
The flow is the current's slope in ATRs per bar, smoothed over 8 bars. A flow of 0.12 ATRs a bar is full colour, and anything inside 15% of that is slack. The current keeps its direction until the slope crosses the slack zone to the other side. That's the turn, and the panel's Since the turn row counts from it.
Layers turn from the inside out
Every layer is coloured by its own slope, smoothed over 12 bars, not by the current's. The first edge turns a few bars after the current and the slow water turns last. So a turn passes through the river from the inside out, and you can see how deep it has gone. Colours move in held steps of a tenth, so fills don't flicker while a slope sits on a boundary.
The wake
The wake is the distance between the current and the slow water, in ATRs. It counts as a wake once it's half an ATR long. It's the memory of the move: how far the market has travelled, in its own volatility units, since the slow water last caught up.
| Wake reading | What it means |
|---|---|
| Growing | The wake is at its longest so far. A move with momentum behind it. |
| Stretched | Longer than three quarters of the last twenty wakes. This move has run further than the market usually does lately. Not a reversal call, strong trends stay stretched; a reason not to chase. |
| Fading | The wake has given back a quarter of its longest length. The move is losing speed, a time to tighten up. |
| Turning | The current is already flowing against the wake. The first stage of a turn, and the stage where most turns fail. |
Price and the stream
Price is on the stream while it closes within 0.75 ATRs of the current. It has left the stream when it closes 1.5 ATRs away, and rejoined when it's back within 0.75. The gap is deliberate, so price can hover at the edge without an event every bar.
The pullback
A pullback is only looked for while the river flows one way and the wake agrees. It arms when price leaves the stream on the flowing side, and fires when a bar comes back within 0.25 ATRs of the current and closes back on the flowing side. Price has to leave the stream again before another can fire, which keeps it to a few per trend and none in slack water.
The panel
| Row | What it shows |
|---|---|
| Current | Flowing up or down, with strong, moderate or weak, or Slack. |
| Layers | How many of the four layers flow each way. 4 of 4 up is full flow, 2 up and 1 down is a turn in progress, all slack is a dead market. |
| Wake | Direction and length in ATRs, and whether it's growing, stretched, fading or turning. |
| Price | On the stream, or above or below it by so many ATRs. |
| Since the turn | Bars since the current last changed direction. |
| Last event | The most recent event and how long ago. On the live bar it shows as pending until the bar closes. |
Events and alerts
One event per bar, most important first:
- The current turning up or down
- A pullback to the current that held
- Price leaving the stream
- Price rejoining the stream
- The wake fading (once per wake)
- The wake stretching (once per wake)
Fading and stretched carry over to the next bar if something bigger took the slot. Set alerts to Once per bar close.
How to read it
- 1Colour firstMint is flowing up, pink is flowing down, blue is slack. Slack water means don't trend-trade here. The layers behind the current tell you whether the rest of the river agrees.
- 2Then the wakeGrowing means momentum, stretched means don't chase, fading means tighten up, turning means the old move is being tested.
- 3Trade with the currentPrice leaving the stream on the flowing side is a market extended from its current; it tends to come back before it goes on. The pullback event is that return. Leaving against the flow, or the current turning while the wake is long, is a trend being tested.
Timeframes
With the defaults, on a 5 minute chart the wake describes the last few hours, on a 1 hour chart a few days, and on a daily chart about a quarter. Wake lengths and the stretched reading scale with the chart because everything is in ATRs. Stretched is relative to the market in front of you: two ATRs can be stretched on a quiet day and ordinary on a wild one.
Common questions
Yes. It's free and open source on TradingView, no membership needed.
Every bar of the river is built only from the bars before it, so history doesn't change. The current and layers update on the live bar like any moving average. Events are decided on closed bars and never move afterwards.
No. Strong trends can stay stretched for a long time. It means this move has run further than the market usually runs lately, so it's a reason not to chase.
Any. Everything is measured in ATRs, so the same settings mean the same thing on gold, bitcoin or a stock.