How to Use the Simple Oscillator
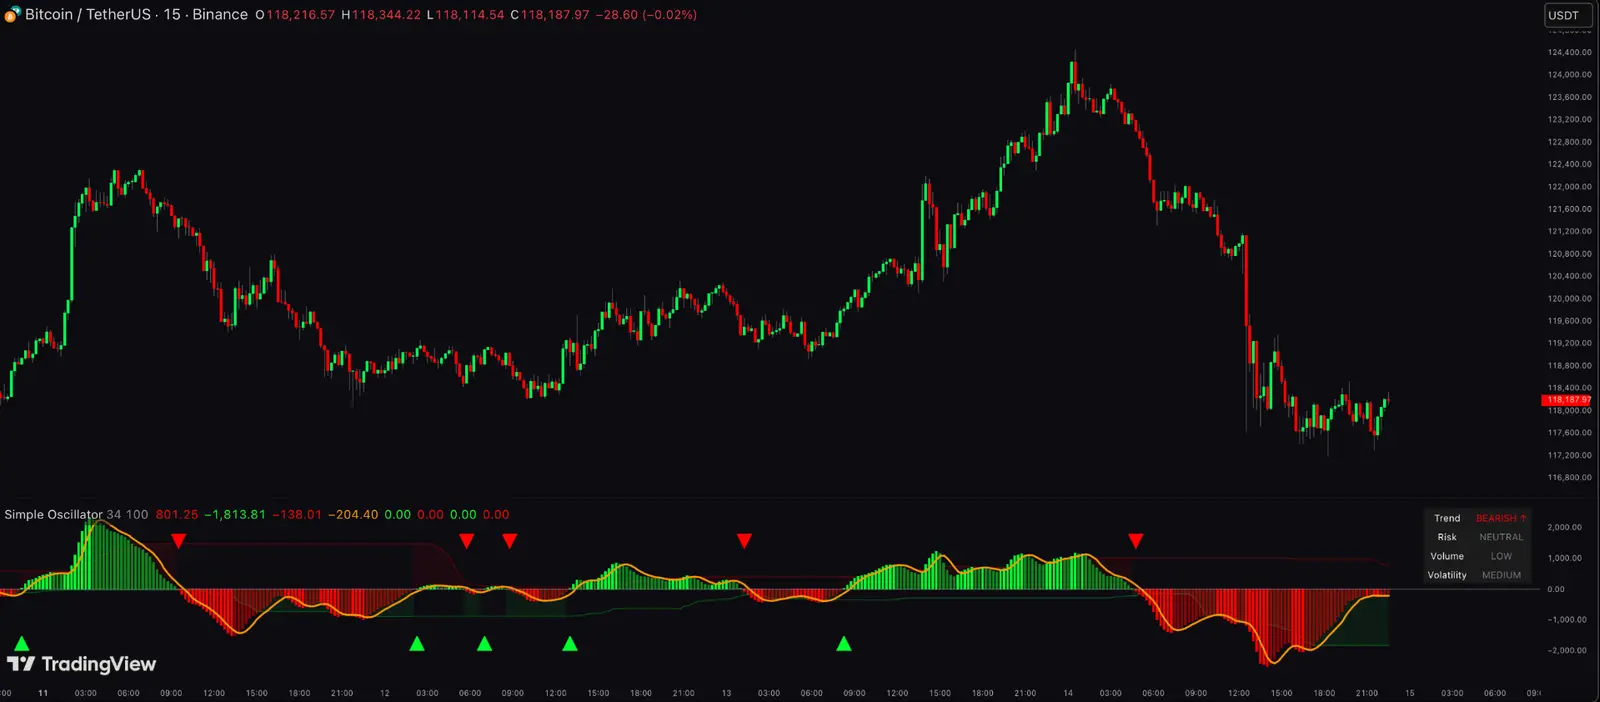
The Simple Oscillator is a momentum-based tool designed to measure momentum strength, trend bias, and potential reversal conditions. It provides visual feedback on market behavior and helps traders make informed decisions.
Important Disclaimer
The Simple Oscillator is an analytical tool—not a guarantee of profitable trades. All signals should be confirmed with additional analysis, proper risk management, and alignment with your trading strategy. No indicator can predict market movements with certainty.
Overview
The Simple Oscillator measures the rate of change in price momentum and displays it as a histogram that oscillates above and below a zero line. It helps traders identify:
- • Momentum strength and direction
- • Potential trend bias (bullish or bearish)
- • Overbought and oversold conditions
- • Divergences that may signal reversals
- • Momentum shifts and acceleration/deceleration
Reading Momentum Bars
The oscillator displays momentum as colored histogram bars. The color and intensity communicate different market states:
Bright Green Bars
Bullish momentum is increasing. Price is accelerating upward with growing strength.
Faded Green Bars
Bullish momentum is weakening. Price may still be rising, but the rate of increase is slowing.
Bright Red Bars
Bearish momentum is increasing. Price is accelerating downward with growing strength.
Faded Red Bars
Bearish momentum is weakening. Price may still be falling, but the rate of decline is slowing.
Pro Tip
Pay attention to color transitions. When bright bars fade, it often signals exhaustion. When faded bars brighten, it may indicate renewed momentum entering the market.
Zero Line Behavior
The zero line acts as the equilibrium point between bullish and bearish momentum:
Above Zero Line
Indicates bullish momentum bias. Price has positive momentum and buyers are in control.
Below Zero Line
Indicates bearish momentum bias. Price has negative momentum and sellers are in control.
Zero Line Crosses
When the oscillator crosses the zero line, it may signal a momentum shift. Crossing above zero suggests bullish momentum taking over; crossing below suggests bearish momentum taking over.
Using the Signal Line (Optional)
The signal line is a smoothed moving average of the oscillator that helps identify momentum acceleration and deceleration:
Oscillator Crossing Above Signal Line
Suggests upward momentum acceleration. Bullish momentum may be strengthening.
Oscillator Crossing Below Signal Line
Suggests downward momentum deceleration. Bearish momentum may be strengthening.
Overbought/Oversold Zones
The oscillator includes dynamic zones that adapt to market conditions and highlight areas where momentum may be stretched:
Overbought Zone
When momentum bars extend into the upper zone, it indicates potentially excessive bullish momentum. This doesn't mean "sell immediately," but rather suggests caution and the possibility of a pullback or consolidation.
Oversold Zone
When momentum bars extend into the lower zone, it indicates potentially excessive bearish momentum. This suggests caution and the possibility of a bounce or relief rally.
Important Note
Overbought conditions can persist in strong trends. Do not blindly fade overbought/oversold readings—wait for confirmation from price action, structure, or other confluence factors.
Divergences
Divergences occur when price action and momentum behavior disagree, potentially signaling reversals or momentum shifts:
Bullish Divergence
Price makes a lower low, but the oscillator makes a higher low. This suggests weakening bearish momentum and a potential upward reversal.
What to Look For:
- • Clear lower low in price
- • Higher low in oscillator momentum bars
- • Confirmation from price structure or other indicators
- • Momentum beginning to turn positive
Bearish Divergence
Price makes a higher high, but the oscillator makes a lower high. This suggests weakening bullish momentum and a potential downward reversal.
What to Look For:
- • Clear higher high in price
- • Lower high in oscillator momentum bars
- • Confirmation from price structure or other indicators
- • Momentum beginning to turn negative
Critical: Divergences Must Be Confirmed
Divergences are not standalone trade signals. They highlight potential momentum shifts but require confirmation from price action breaking structure, respecting support/resistance, or aligning with other confluence factors.
Buy/Sell Signal Markers (Optional)
The Simple Oscillator can display optional buy and sell signal markers when momentum conditions align:
These visual cues appear when the oscillator detects favorable momentum conditions, but they are not guaranteed entry points.
Treat these as alerts to investigate potential opportunities. Confirm with price structure, trend direction, support/resistance levels, and risk management before entering any position.
Best Practices
1. Wait for Confirmation
Never trade based on the oscillator alone. Confirm signals with price structure, support/resistance zones, breakout patterns, or other SimpleAlgo tools.
2. Follow the Trend
Momentum signals aligned with the overall trend direction have higher probability. Counter-trend signals require stronger confluence and tighter risk management.
3. Adjust for Volatility
In high volatility environments, overbought/oversold readings may be less reliable. Consider the overall market context when interpreting oscillator behavior.
4. Use Multi-Timeframe Confluence
Check the oscillator on higher timeframes for directional bias. Momentum aligned across multiple timeframes provides stronger confirmation.
5. Combine with Proper Risk Management
Always use stop losses and position sizing appropriate to your account and strategy. No momentum tool eliminates risk—manage it systematically.
Common Mistakes to Avoid
- ✗Trading every oscillator signal without additional confluence
- ✗Ignoring overall trend direction and market structure
- ✗Treating overbought/oversold as automatic reversal signals
- ✗Acting on divergences without price action confirmation
- ✗Using momentum signals without proper stop losses
- ✗Expecting the oscillator to predict future price movement with certainty
Final Thoughts
The Simple Oscillator is a powerful momentum tool when used responsibly. It provides context and visual feedback on market behavior, but it cannot replace sound analysis, risk management, and trading discipline. Use it as one layer of confluence within your complete trading framework.