Reversal Tools
SimpleAlgo's reversal tools help you identify potential turning points in the market by detecting momentum shifts, structural breaks, and exhaustion patterns.
Important Warning
Reversal trading is inherently riskier than trend following. These tools are early warning indicators and should always be combined with confirmation signals, structure analysis, and proper risk management before taking action.
Show Reversals
Small diamond markers at candle tops and bottoms
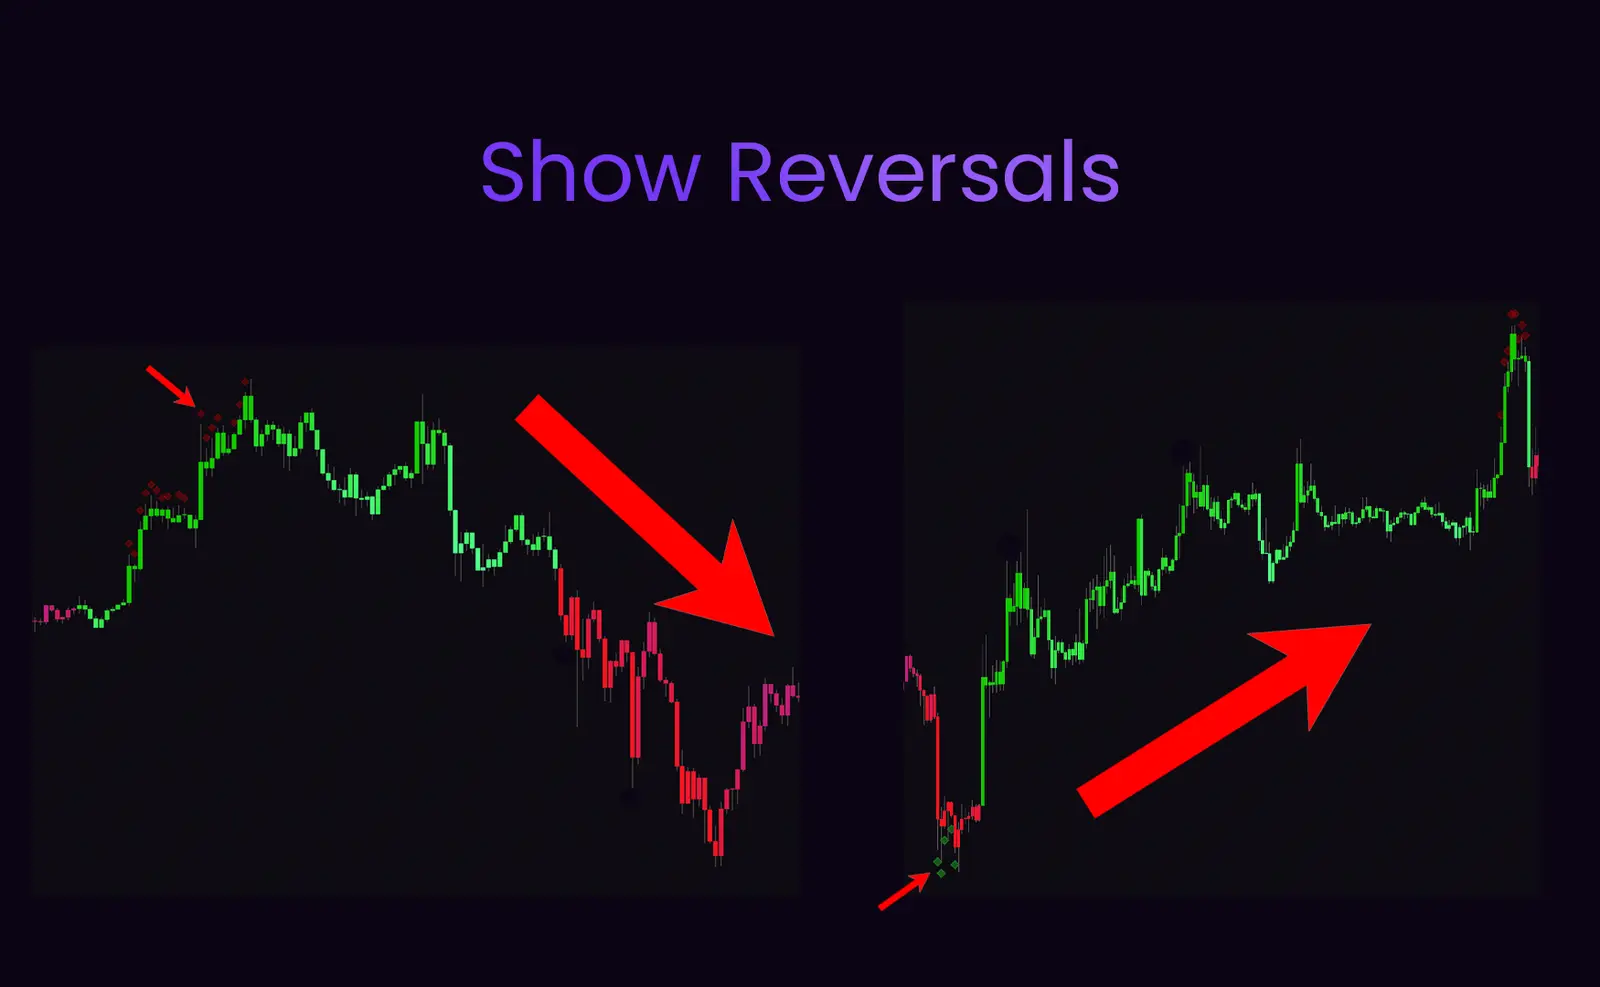
Show Reversals places diamond markers on your chart when the algorithm detects reversal-like behavior using internal momentum calculations, structural shifts, and volatility compression patterns.
How It Works
Top Diamonds (Bearish Reversal)
Appear when:
- • Price reaches local highs
- • Momentum begins weakening
- • Volatility compression detected
- • Structural rejection occurring
Bottom Diamonds (Bullish Reversal)
Appear when:
- • Price reaches local lows
- • Selling pressure weakening
- • Momentum shift beginning
- • Potential bounce zone forming
Trading with Show Reversals
✓ Best Practices
- • Wait for a confirmation signal after the diamond appears
- • Check if diamond aligns with Reversal Bands extremes
- • Verify structural context using Swing Points and Support/Resistance
- • Consider the Active Trend—reversals against strong trends often fail
- • Use tighter stops when trading reversal setups
✗ Common Mistakes
- • Entering immediately when diamond appears (these are early warnings, not entries)
- • Ignoring overall trend direction
- • Trading every diamond without additional confluence
- • Not using stop losses
Show Swing Points
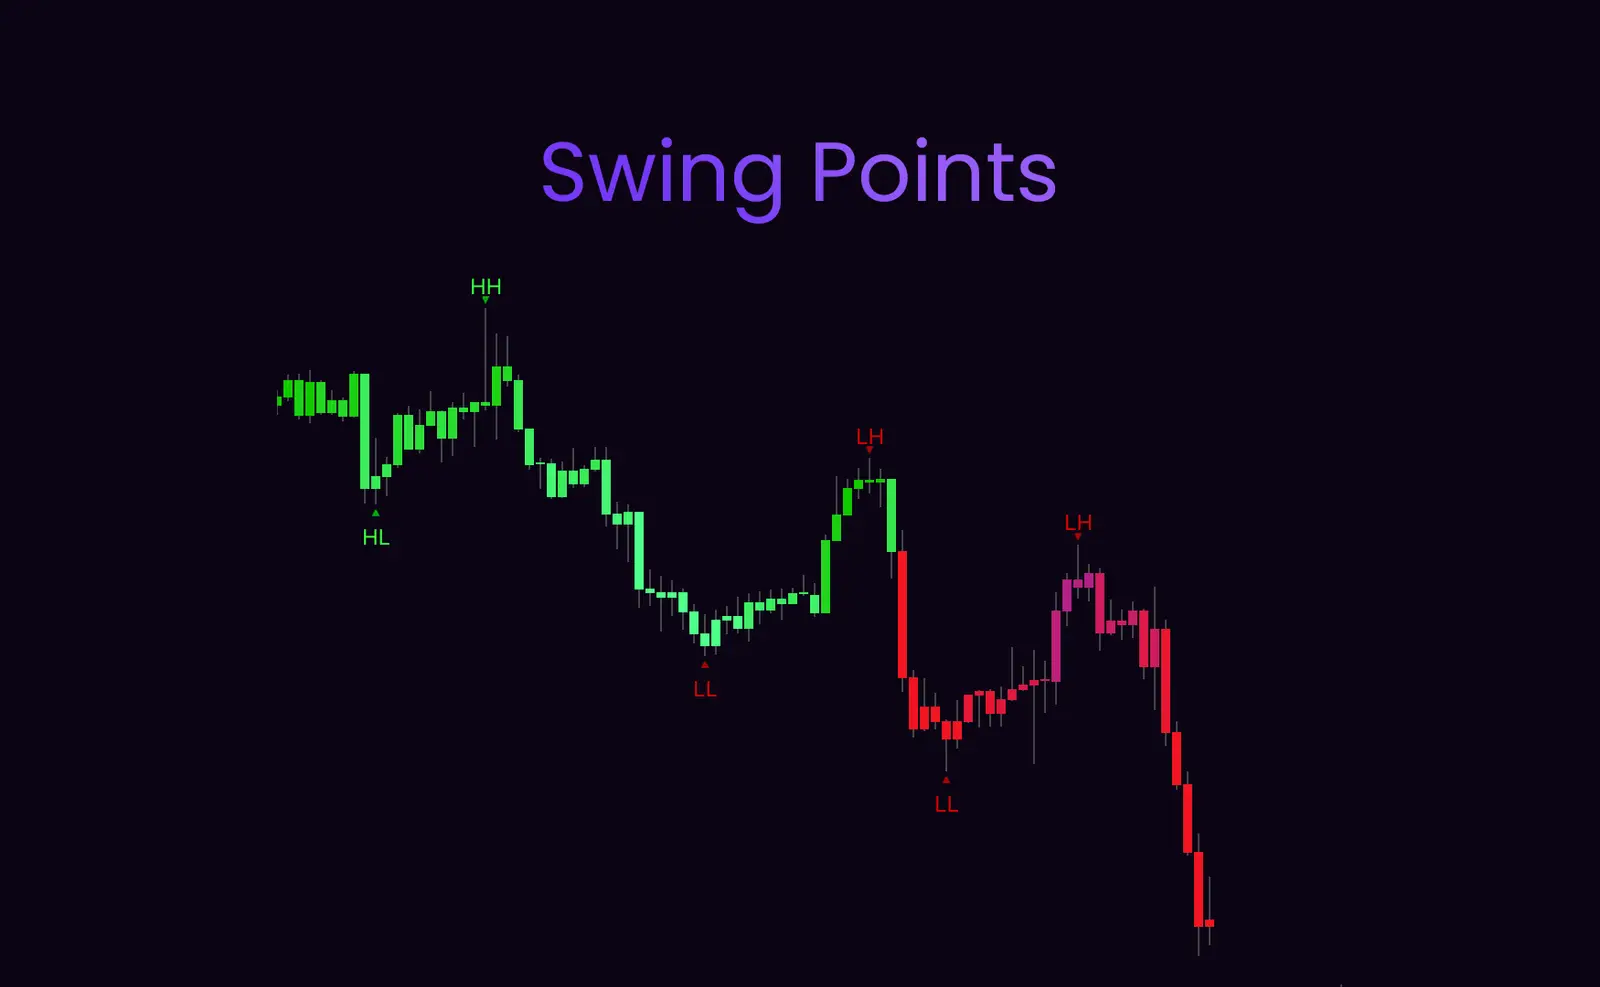
Swing Points automatically plot key structural points on your chart: Higher Highs (HH), Higher Lows (HL), Lower Highs (LH), and Lower Lows (LL). This reveals trend direction, structure shifts, and potential break of structure events.
Understanding Swing Points
Higher High (HH) + Higher Low (HL)
Pattern indicating an uptrend. Price is making higher peaks and higher valleys, showing bullish momentum and structure.
Lower High (LH) + Lower Low (LL)
Pattern indicating a downtrend. Price is making lower peaks and lower valleys, showing bearish momentum and structure.
Mixed Swing Points
When swing points become erratic (e.g., LH followed by HH), it often signals consolidation, trend exhaustion, or an impending reversal.
Break of Structure (BOS)
A Break of Structure occurs when price violates a previous swing high (in a downtrend) or swing low (in an uptrend). This is a powerful signal that the trend may be reversing.
Bullish BOS
During a downtrend (LL + LH pattern), price breaks above a previous LH. This suggests potential trend reversal to bullish.
Bearish BOS
During an uptrend (HH + HL pattern), price breaks below a previous HL. This suggests potential trend reversal to bearish.
Trading with Swing Points
Identify the Trend
Use swing point patterns to determine if you're in an uptrend (HH/HL), downtrend (LH/LL), or consolidation (mixed).
Wait for Break of Structure
When price breaks structure, wait for a confirmation signal in the new direction before entering.
Use Swing Points as Support/Resistance
Previous swing highs and lows often act as key support/resistance levels. Look for reversals or continuations at these zones.
Combine with Other Tools
Swing points become most powerful when combined with Show Reversals, Reversal Bands, and confirmation signals.
Combining Reversal Tools
High-Probability Reversal Setup
The strongest reversal signals occur when multiple tools align:
- ✓ Show Reversals diamond appears at candle extreme
- ✓ Price is at Reversal Band upper/lower boundary
- ✓ Swing Point shows potential Break of Structure
- ✓ Confirmation signal appears after diamond
- ✓ Support/Resistance level nearby
- ✓ Active Trend showing signs of weakening
Pro Tip for Reversal Trading
The safest reversal trades come after a clear trend has exhausted and multiple reversal tools align. Attempting to catch reversals too early is a common mistake. Patience and confluence are critical.