Introducing RSI Master: A Free RSI Indicator That Shows the Price
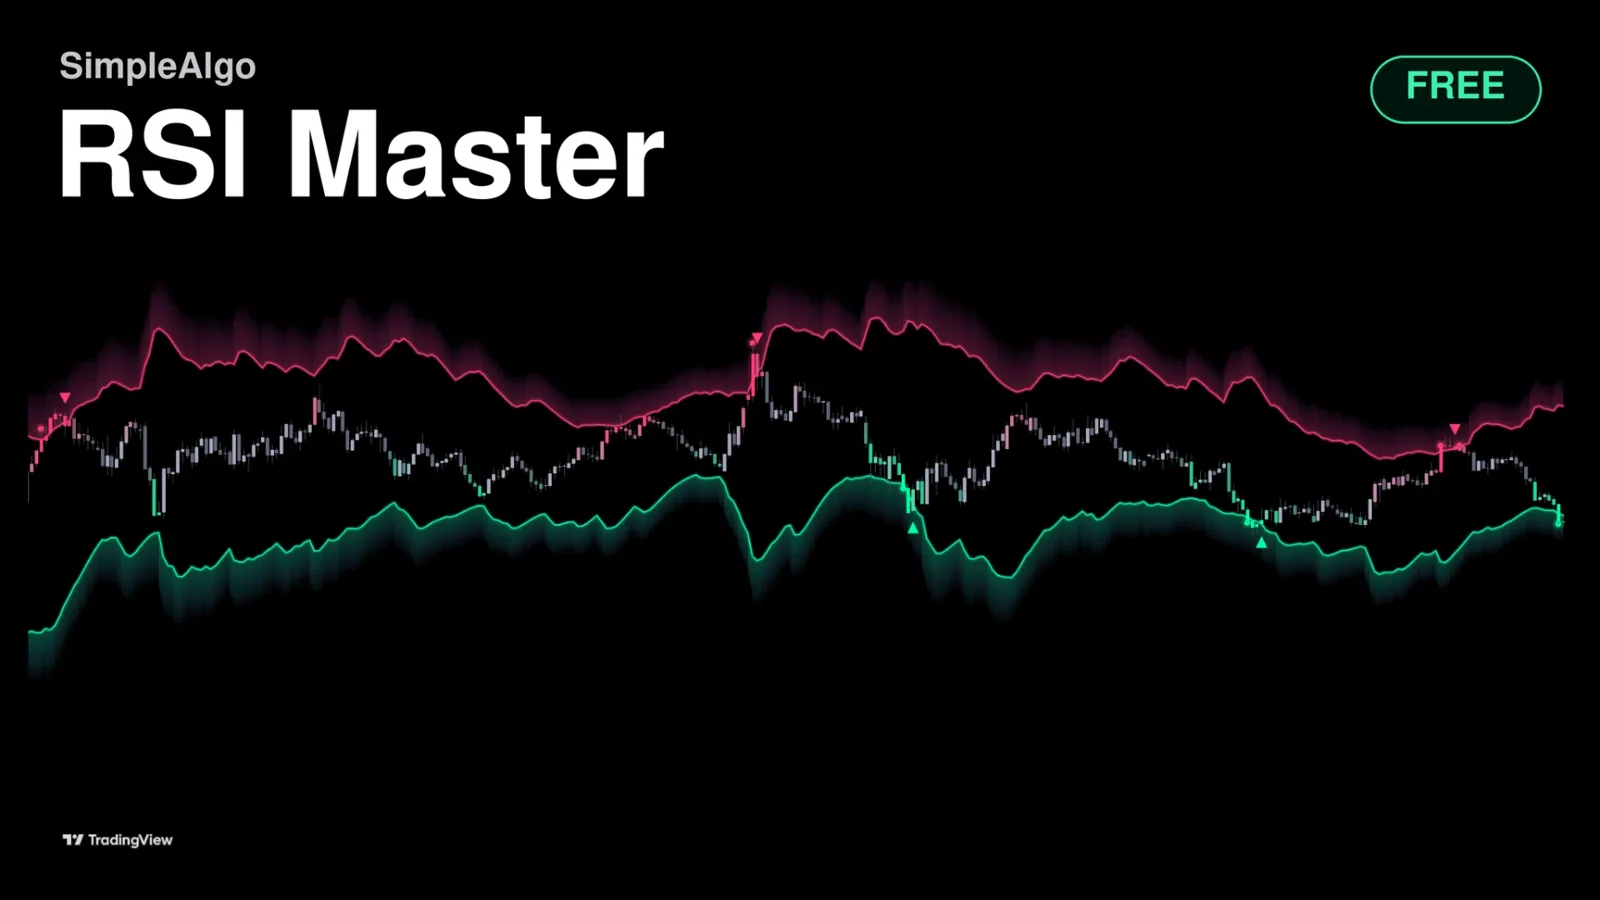
RSI Master is a new free, open-source TradingView indicator. It draws the exact prices where overbought and oversold begin, right on your chart.
Introducing RSI Master: A Free RSI Indicator That Shows the Price
We just released RSI Master, a free and open-source indicator on TradingView.
RSI tells you a number. It doesn't tell you a price. You look down at the pane, see 63, and the question you actually have is the one it can't answer: how far does price have to go before this is overbought? RSI Master answers it on the chart.
Two zones, in price
Every bar, RSI Master runs the RSI formula backwards. It finds the exact close that would put RSI at 70 on the next bar, and the exact close that would put it at 30. Those two prices are the edges of two zones: overbought above, oversold below. The gap between price and a zone is the room it has left.
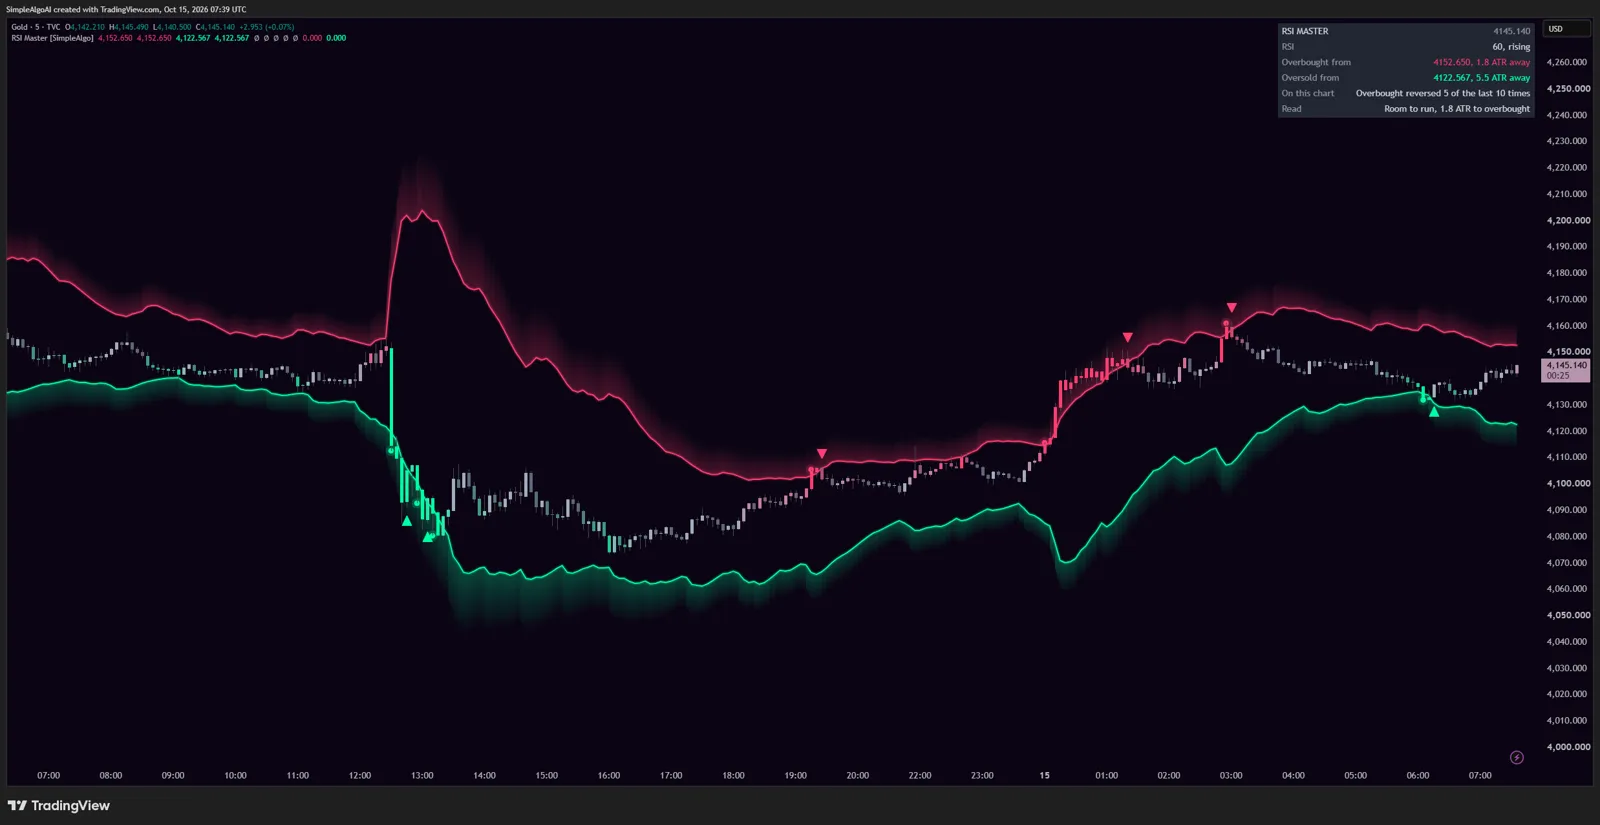
It isn't a band fitted around price. The edges move for a reason you can see: after a big up candle, the price needed to reach overbought is closer than it was.
Candles, dots and arrows
The candles carry the RSI value. They stay grey through the middle of the range, warm toward pink as RSI climbs, cool toward mint as it falls, and light fully once price is inside a zone. A dot marks the first close into a zone and a small arrow marks the exit, the classic RSI signal.
The panel and alerts
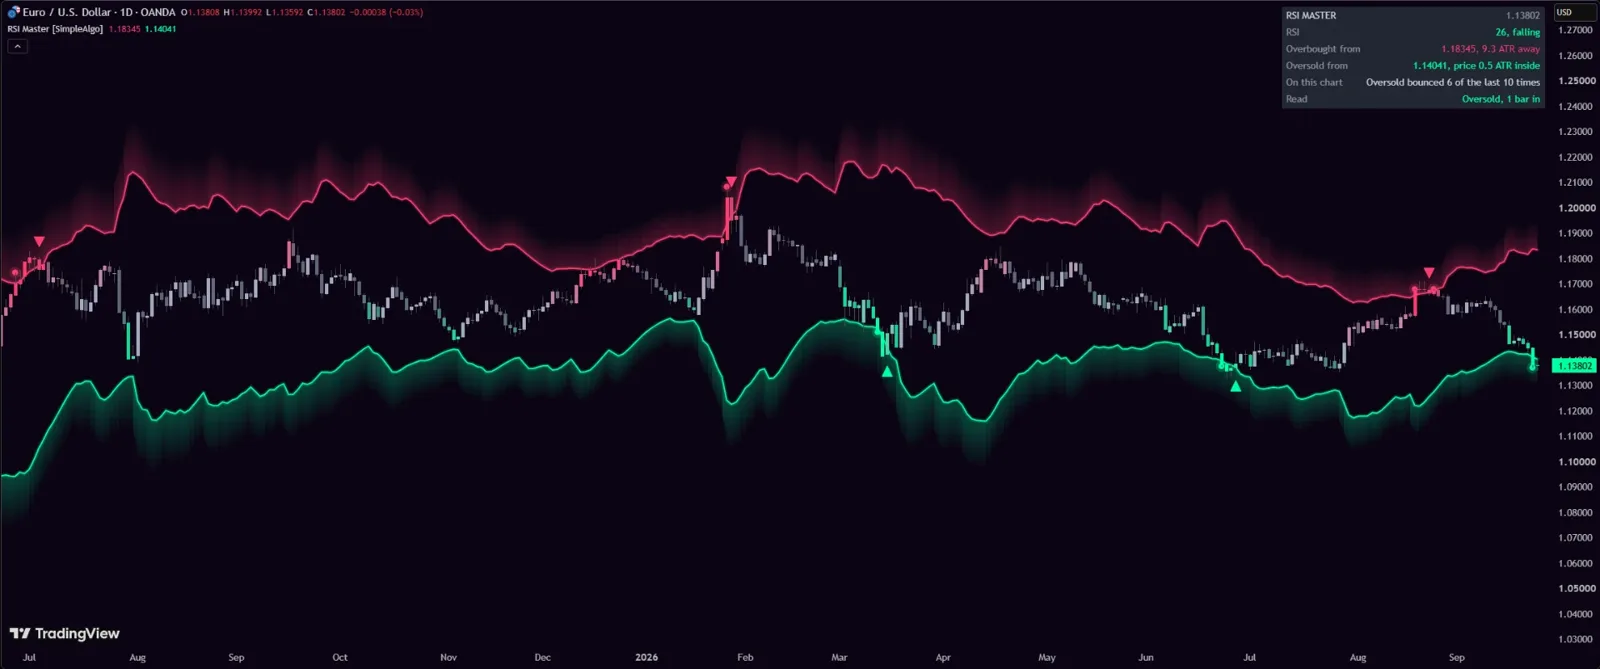
The panel in the corner says it in words: the RSI value, the price overbought starts from and how far away it is, the same for oversold, what happened on this chart the last ten times price reached a zone, and a one-line read. Four alerts cover entering and leaving each zone, decided on closed bars.
None of this predicts where price goes. Overbought describes how far price has come, not a promise it will turn.
Get it
RSI Master is free for everyone, no membership needed. Add it on TradingView, or see it with the rest of our free and premium indicators.
Want every setting, the panel and the alerts explained? Read the full RSI Master guide in the docs.
SimpleAlgo provides educational tools and chart analysis. Nothing here is financial advice. Trading involves substantial risk of loss, and past performance does not guarantee future results.
Written by
Nikolas MetreveliFounder of SimpleAlgo
Nikolas wrote his first real code at 12 and freelanced software tools and websites for small businesses before finding the markets at 15. He builds and maintains every SimpleAlgo indicator and writes these guides from hands-on use of the tools.
More about Nikolas and SimpleAlgoRelated Articles
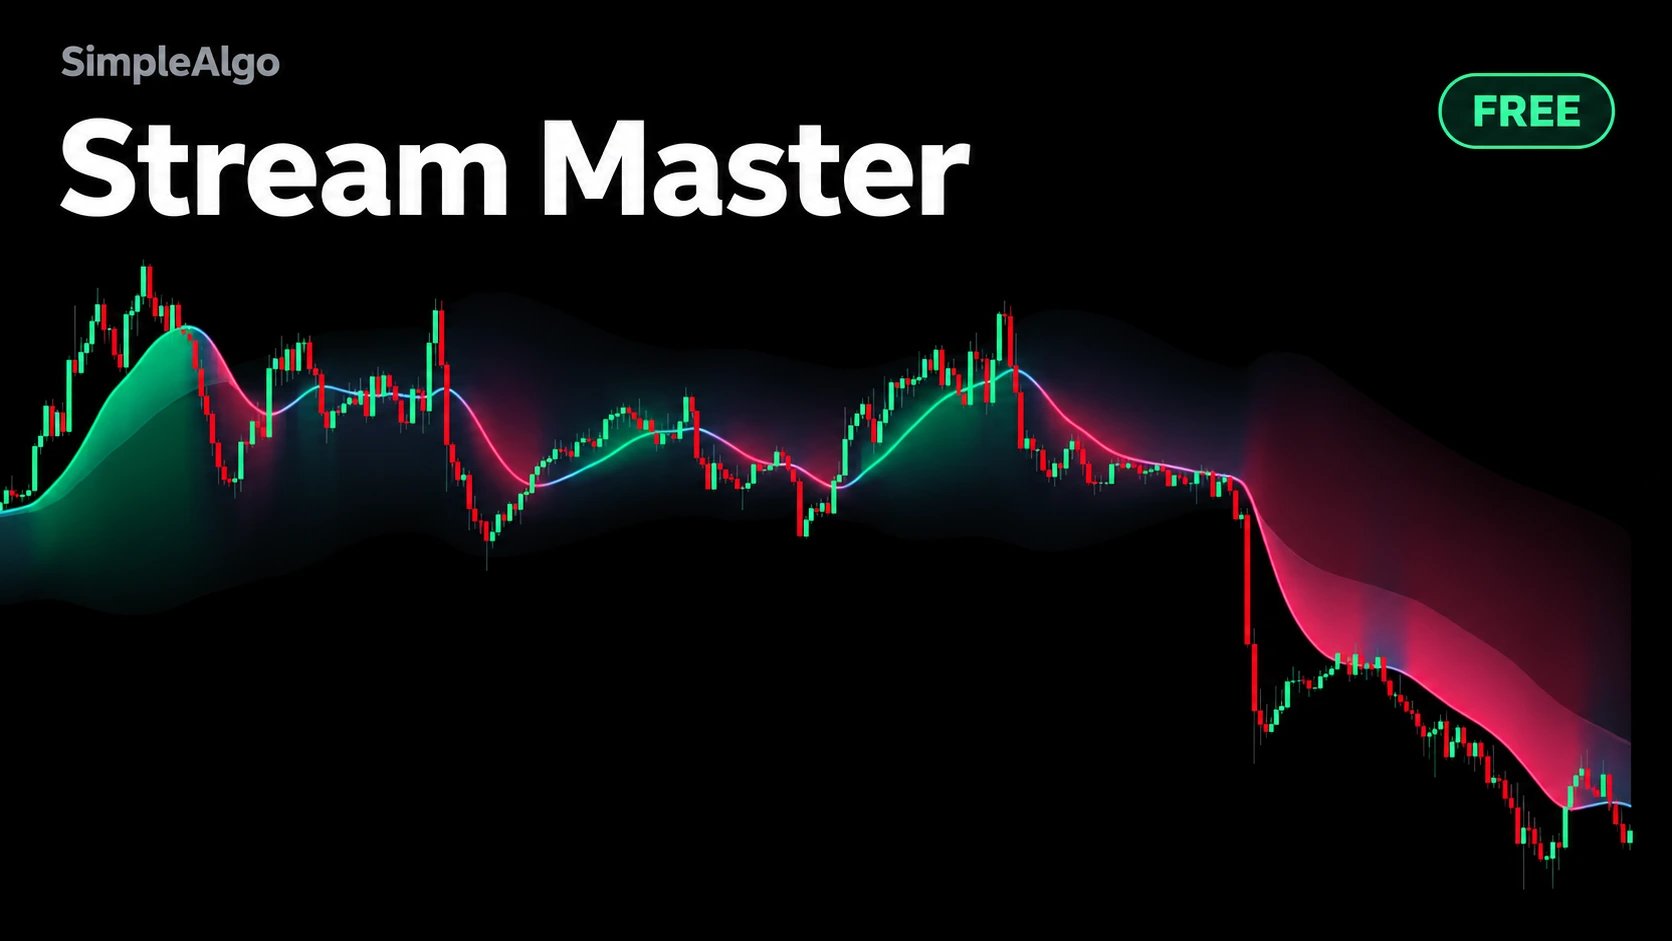
Introducing Stream Master: A Free Trend Indicator Drawn as a River
Stream Master is a new free, open-source TradingView indicator. It shows which way the market flows, how hard, how deep a turn has gone and how long the move has run.
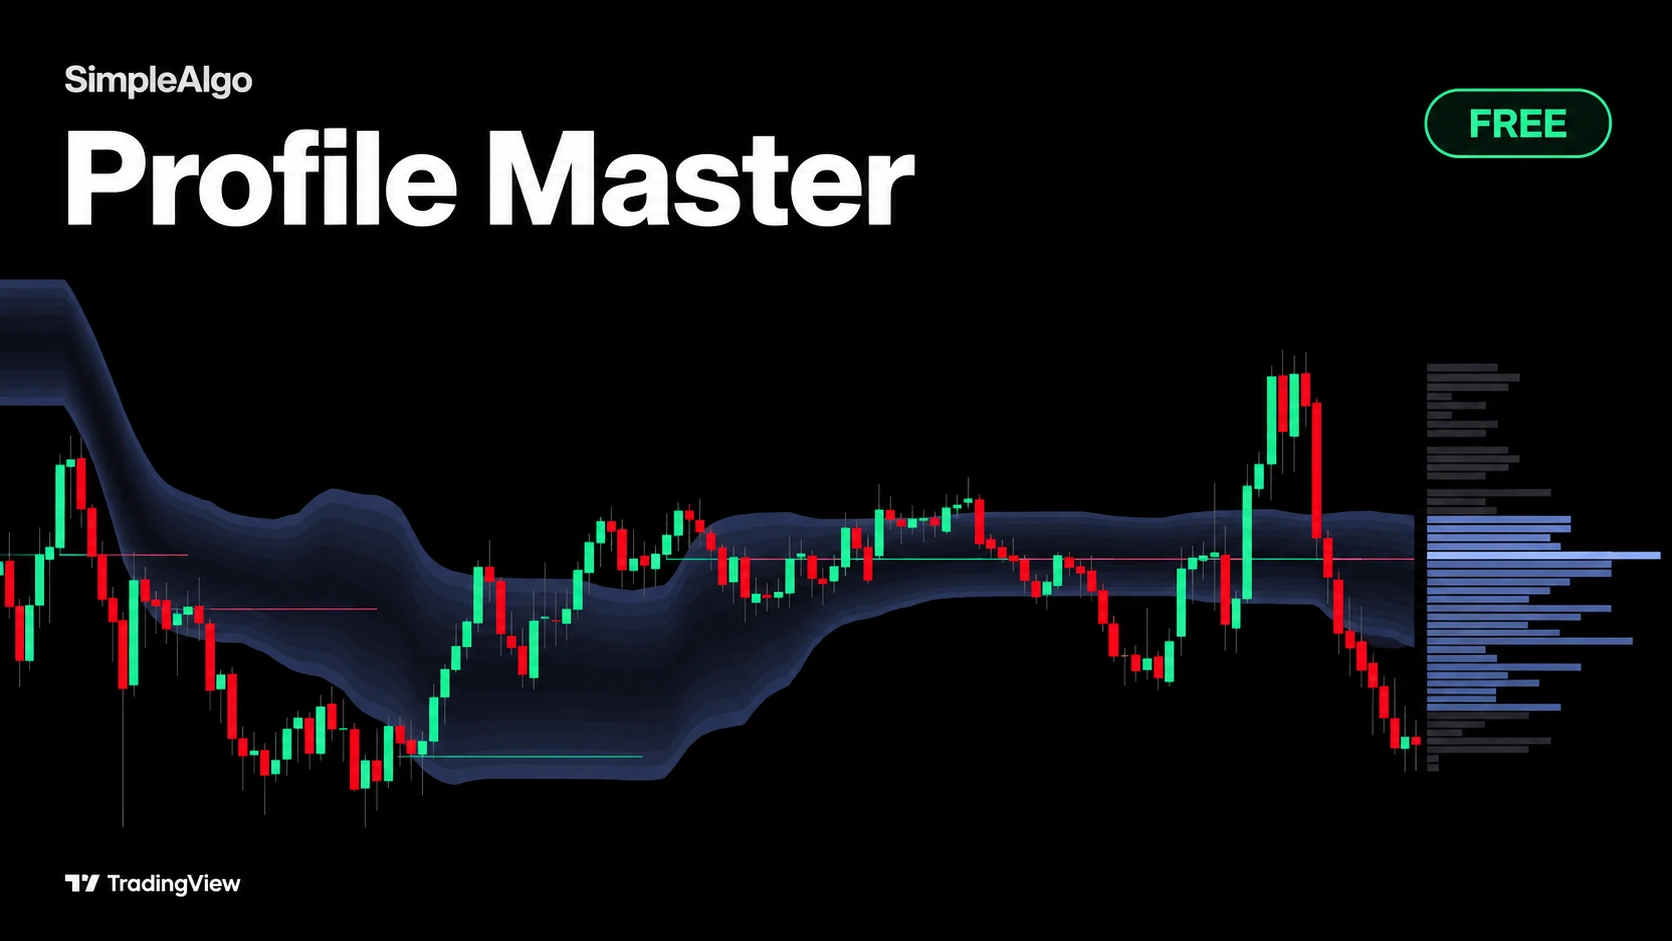
Introducing Profile Master: A Free Volume Profile That Moves With the Chart
Profile Master is a new free, open-source TradingView indicator. It draws the value area as a cloud that travels with price, so you can see where the market is doing business and how value moves.
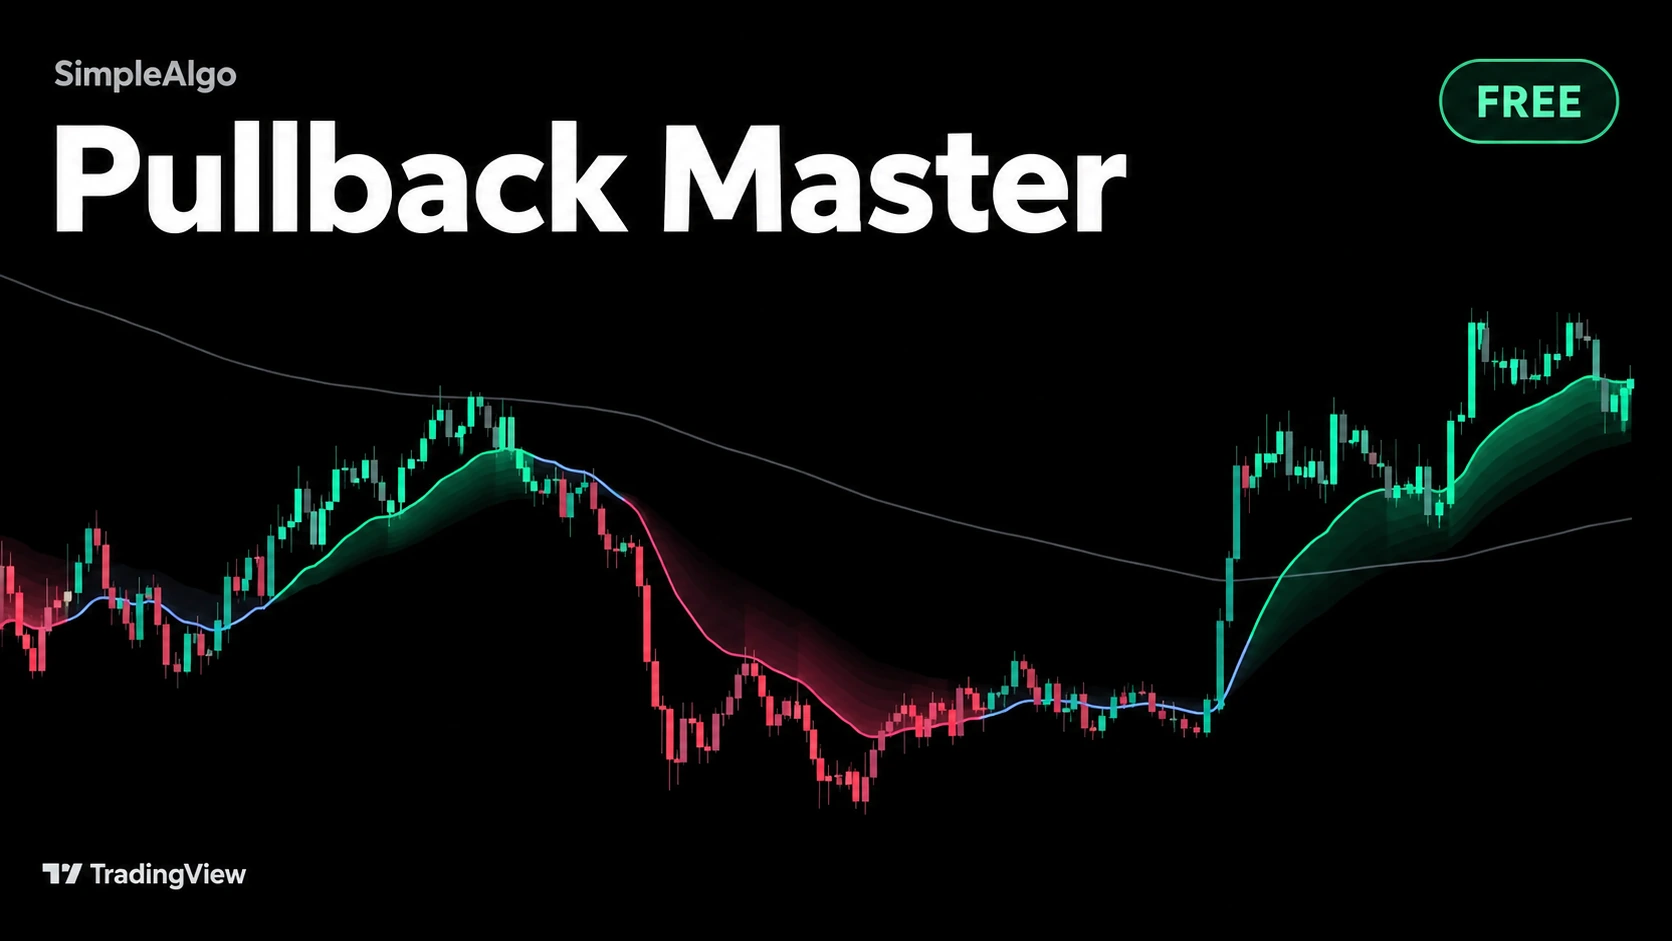
Introducing Pullback Master: A Free Indicator That Counts and Grades Pullbacks
Pullback Master is a new free, open-source TradingView indicator. It finds the trend, counts every pullback that holds inside it, and tells you how deep each one went.
Related tools and guides
Next steps on this topic from the rest of the SimpleAlgo library.