RSI Master
RSI tells you a number. RSI Master tells you the price: exactly where overbought and oversold begin, drawn on the chart.
About RSI Master
RSI Master is a free, open-source RSI indicator for TradingView. You look at RSI, see 63, and the question you actually have is how far price has to go before it's overbought. RSI Master answers it on the chart.
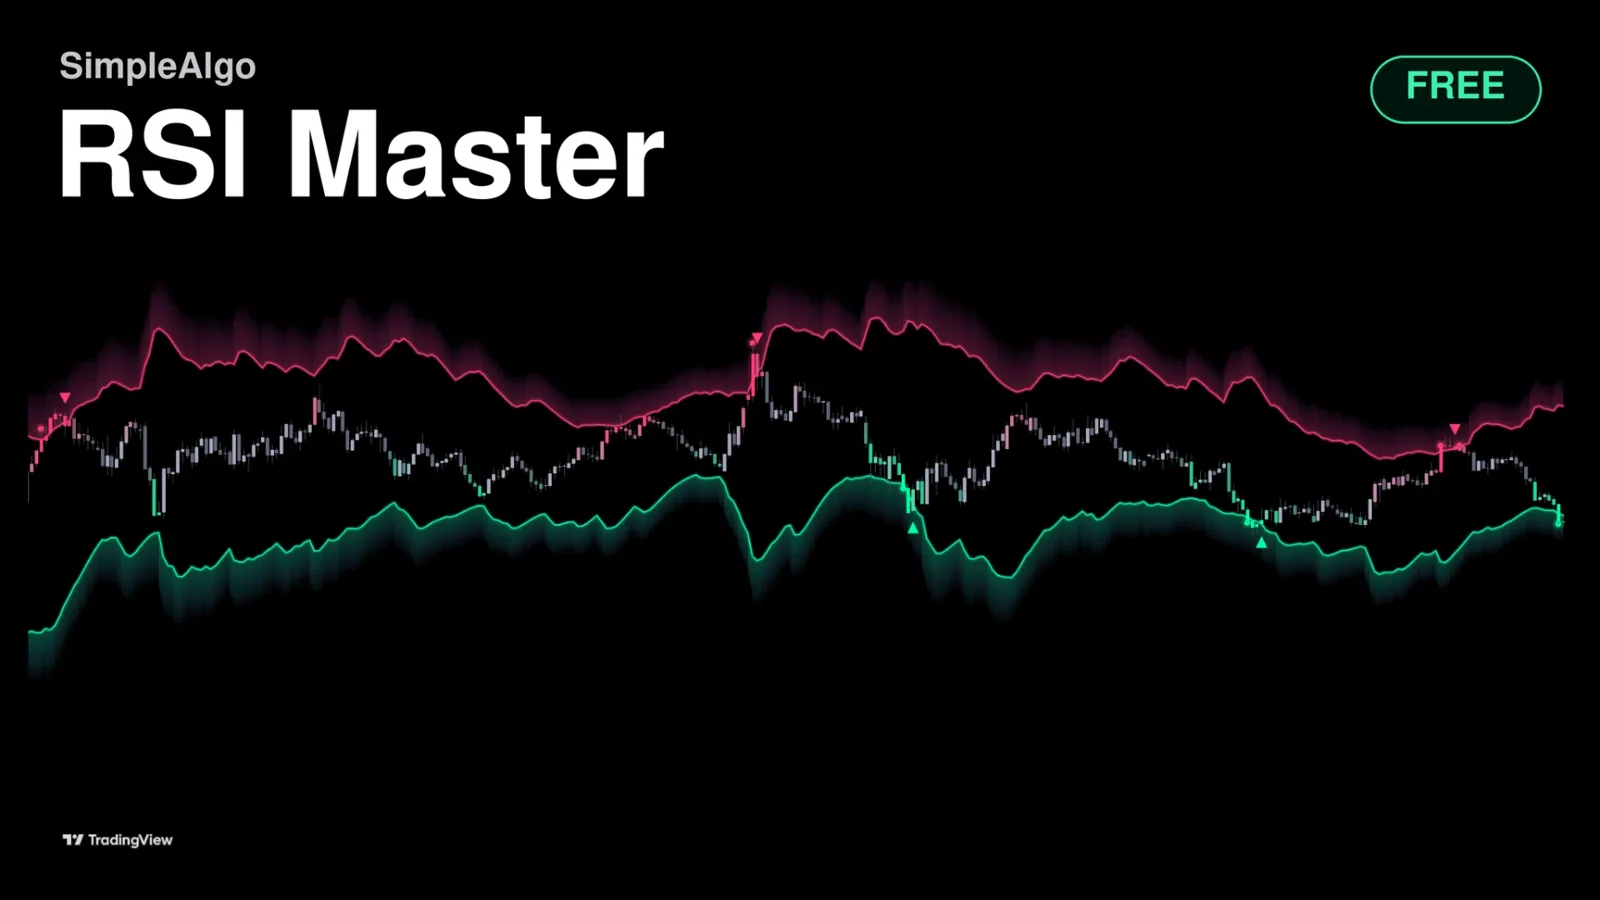
Every bar, it runs the RSI formula backwards and finds the exact close that would put RSI at 70 on the next bar, and the exact close that would put it at 30. Those two prices are the edges of two zones: overbought above, oversold below. The gap between price and a zone is the room it has left.
Candles carry the RSI value too, staying grey through the middle and lighting up as RSI nears a zone. A dot marks the first close into a zone and a small arrow marks the exit. The panel in the corner says it in words, and four alerts cover the events.
What it does
- Overbought and oversold zones drawn as exact prices, not fitted bands
- Standard 14-bar Wilder RSI, matching the RSI in your pane
- Distance to each zone in ATRs, shown on the chart and in the panel
- Candles coloured by the RSI value, fully lit inside a zone
- Entry dots and exit arrows, the classic RSI signal
- A per-chart record of what the last ten zone visits led to
- Four alerts, and Neon, Classic, Aurora, Ice and Custom themes
- Free and open source on TradingView
Want the full suite?
RSI Master is free forever. Premium members also unlock Pro Signals V5 and Simple Screener Pro, all granted straight to their TradingView account.
More free indicators
Profile Master
FreeA volume profile drawn as a cloud that travels with the chart, so you can see where value sits and how it moves.
Pullback Master
FreeA trend, and the pullbacks inside it, counted and graded: which pullback this is, how deep it went and whether it held cleanly.
Stream Master
FreeTrend drawn as a river: which way the market flows, how hard, how deep a turn has gone, and how long the move has run.