Introducing Profile Master: A Free Volume Profile That Moves With the Chart
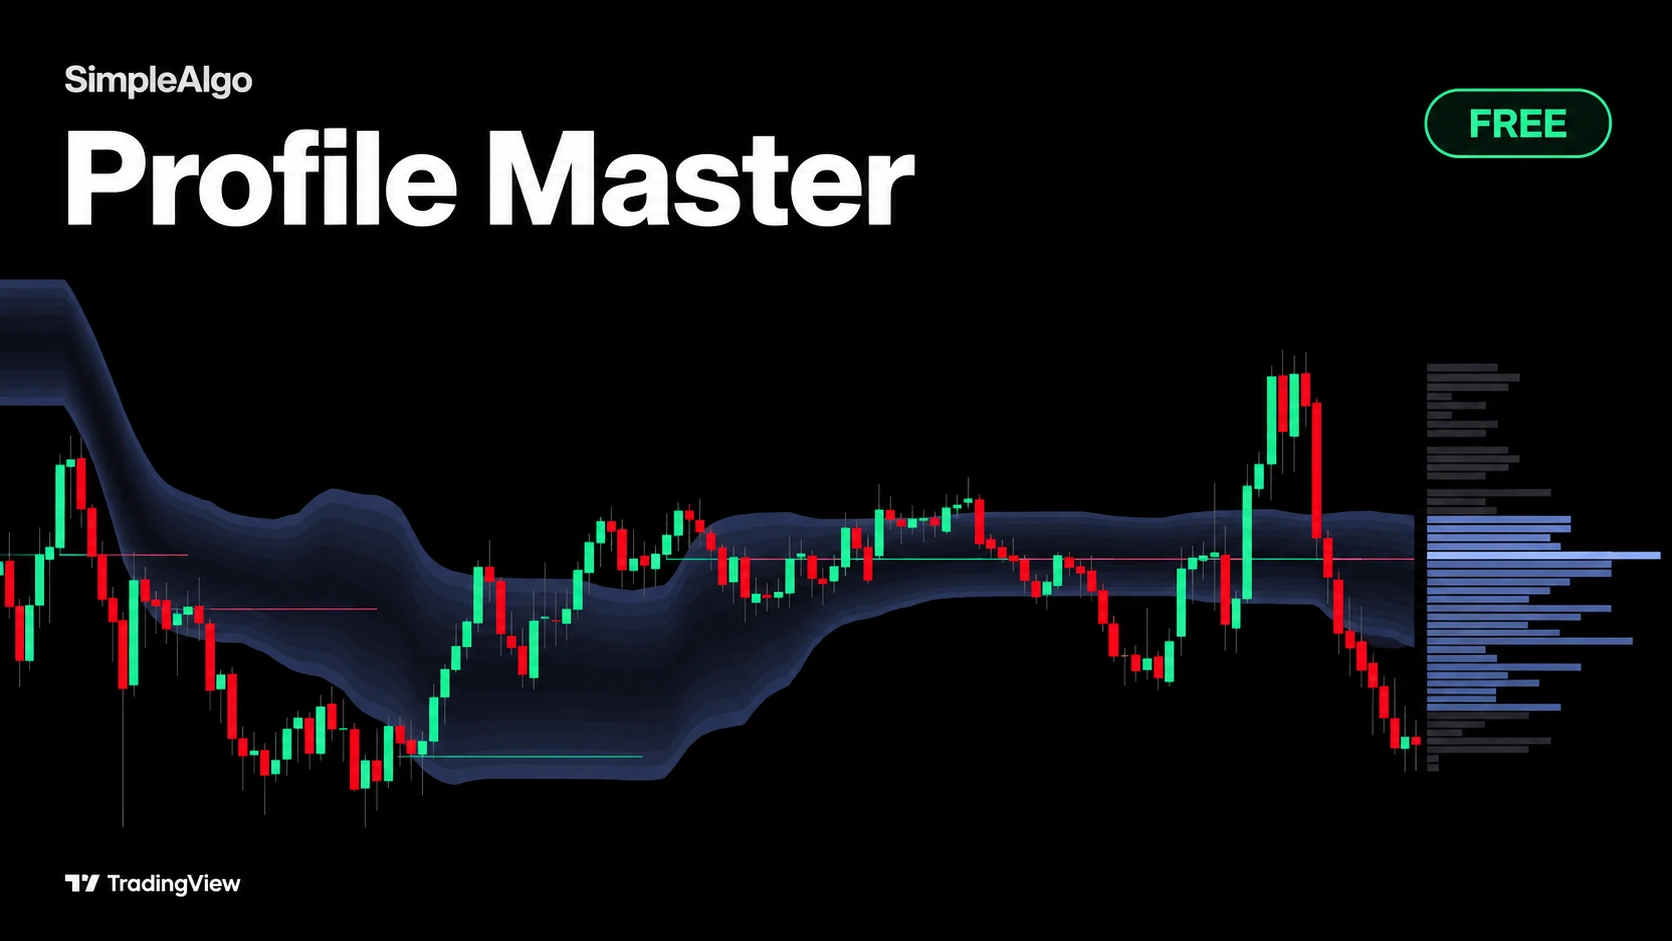
Profile Master is a new free, open-source TradingView indicator. It draws the value area as a cloud that travels with price, so you can see where the market is doing business and how value moves.
Introducing Profile Master: A Free Volume Profile That Moves With the Chart
We just released Profile Master, a free and open-source indicator on TradingView. It answers one question: where has the market been doing business?
A volume profile is usually a histogram pinned to the side of the chart, or a stack of session boxes. Both answer the question for one moment. You get the levels, but you never see how value moved while price moved. Profile Master draws the profile as a cloud that travels with the chart.
What you see
There are no labels on the chart. Price inside the cloud, outside it, or leaving and coming back is the whole read.
What makes it different
Most rolling profiles treat every bar in the window the same until it leaves, and then the value area jumps. Profile Master weights bars by age, so an old session leaves the profile over many bars and value drifts instead.
It also builds the profile from where volume actually traded inside each bar, using lower timeframe data, not from the bar's range. The cloud follows the cluster the market is trading in and never stretches across two of them. And when value moves to a new cluster, the cloud fades while it travels and comes back to full strength when it arrives. A faint trail is value in transit. A bright cloud is value at rest.
How to read it
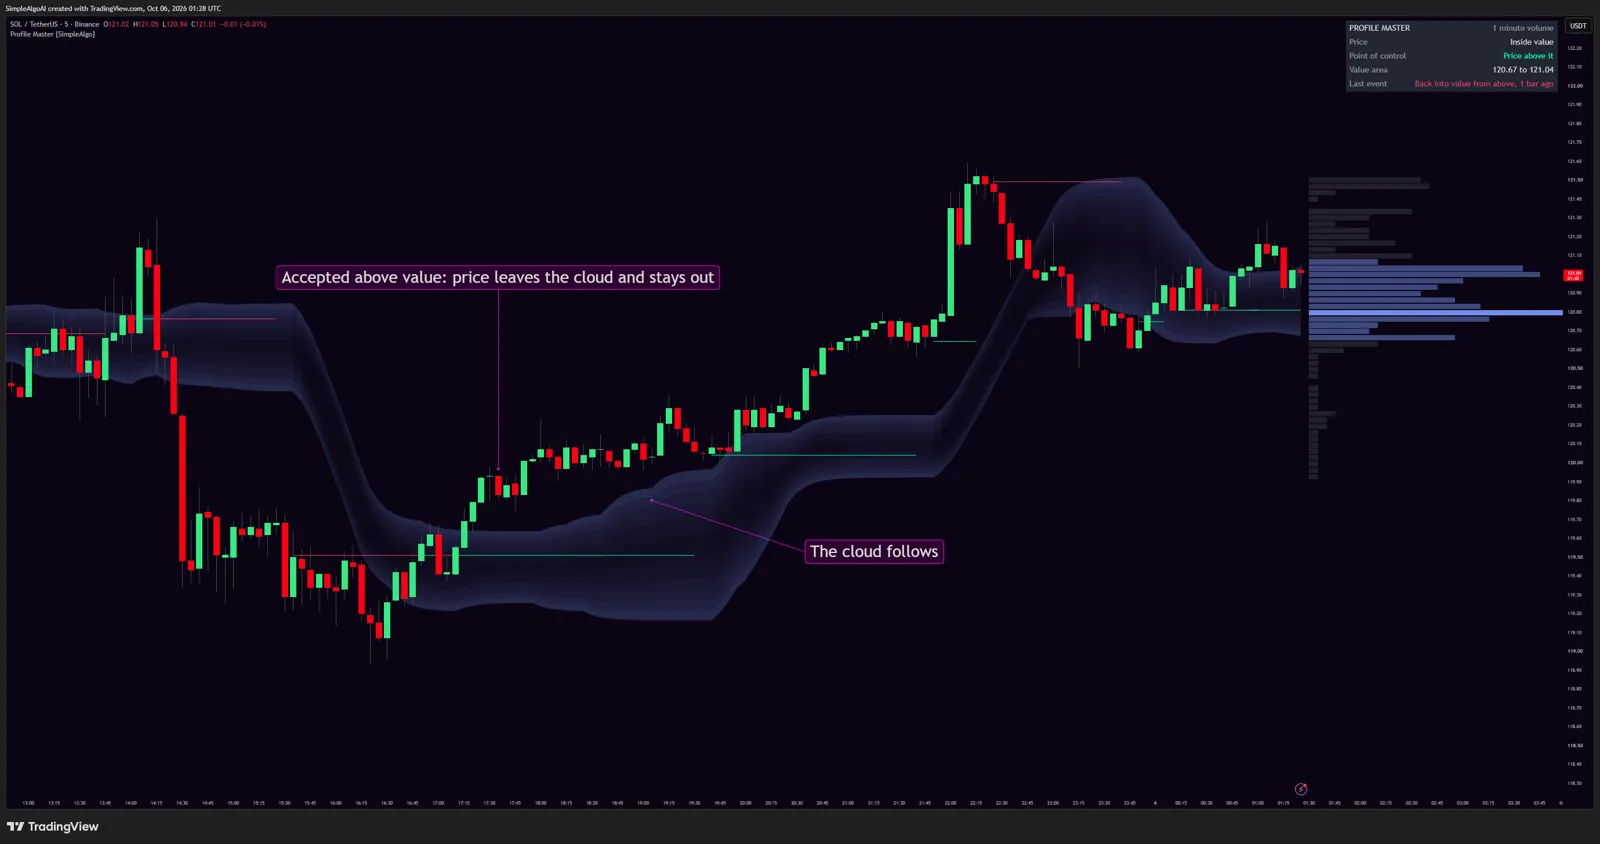
Inside the cloud, the market is doing business where it has been doing business. Expect rotation between the edges and around the control. Outside it, one of two things happens: price gets accepted there and the cloud travels to it, or it gets rejected and comes back in.
Profile Master tracks four events, available as alerts and optional small marks on the chart:
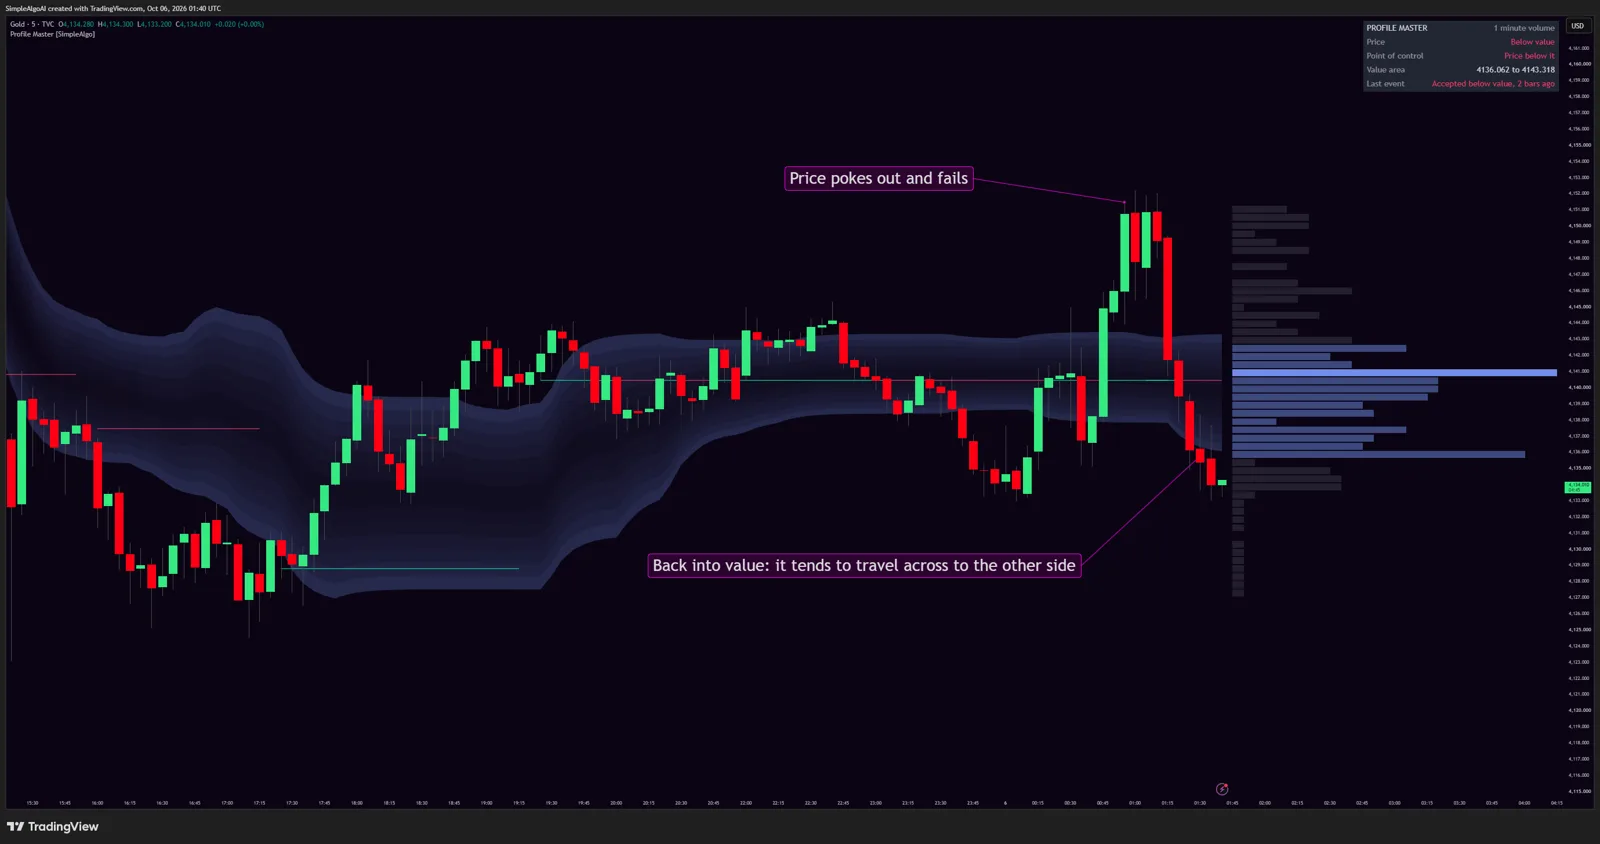
Events only count when price did the moving. If the cloud drifted over to meet a sitting market, nothing fires and the panel simply says Value caught up to price. Events are decided on closed bars and never move afterwards.
Timeframes
On 5 and 15 minute charts the window is a few hours, like a session profile that never resets. On 1 and 4 hour charts it covers days, which is where swing traders find their levels. On the daily chart it's a rolling four month profile.
Get it free
Profile Master is free for everyone, no membership needed. Add it on TradingView, or see it with the rest of our free and premium indicators.
Want every setting, alert and limit explained? Read the full Profile Master guide in the docs.
The cloud is a map of where volume has been, not where price is going, and an event isn't a buy or sell signal. Use it with your own analysis and manage your risk.
SimpleAlgo provides educational tools and chart analysis. Nothing here is financial advice. Trading involves substantial risk of loss, and past performance does not guarantee future results.
Written by
Nikolas MetreveliFounder of SimpleAlgo
Nikolas wrote his first real code at 12 and freelanced software tools and websites for small businesses before finding the markets at 15. He builds and maintains every SimpleAlgo indicator and writes these guides from hands-on use of the tools.
More about Nikolas and SimpleAlgoRelated Articles
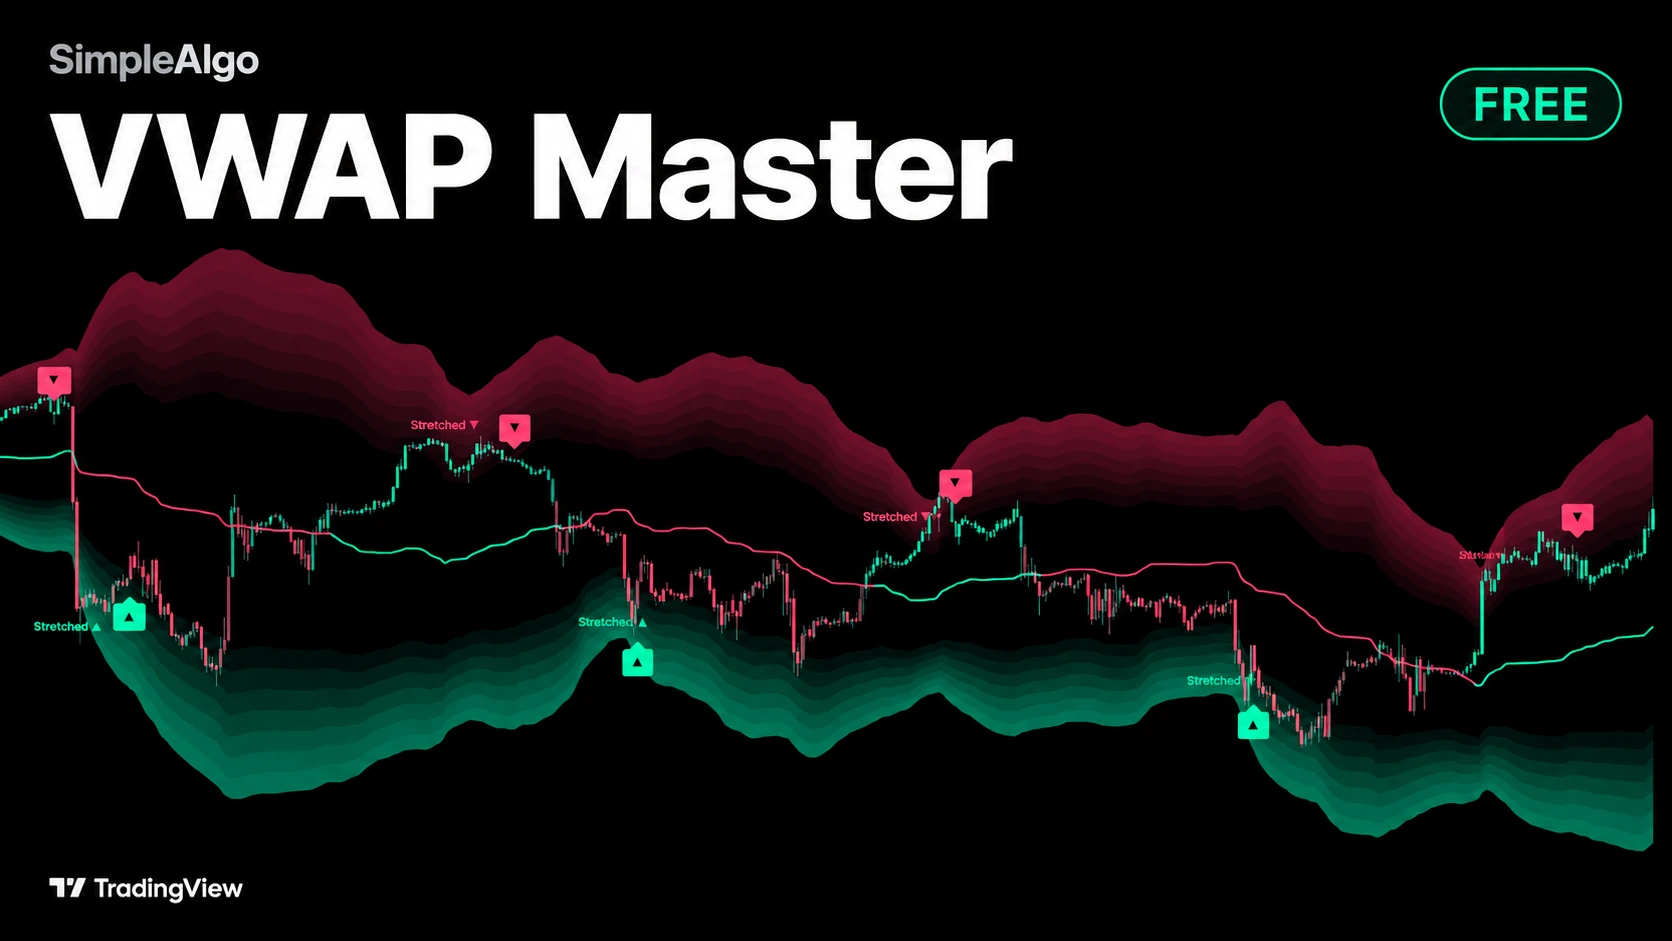
VWAP Master: A Free VWAP Indicator With Bands and Bounce Signals
VWAP Master is our newest free, open-source TradingView indicator. Smooth deviation bands, stretched tags and bounce arrows show when price is far from value and starting to snap back.
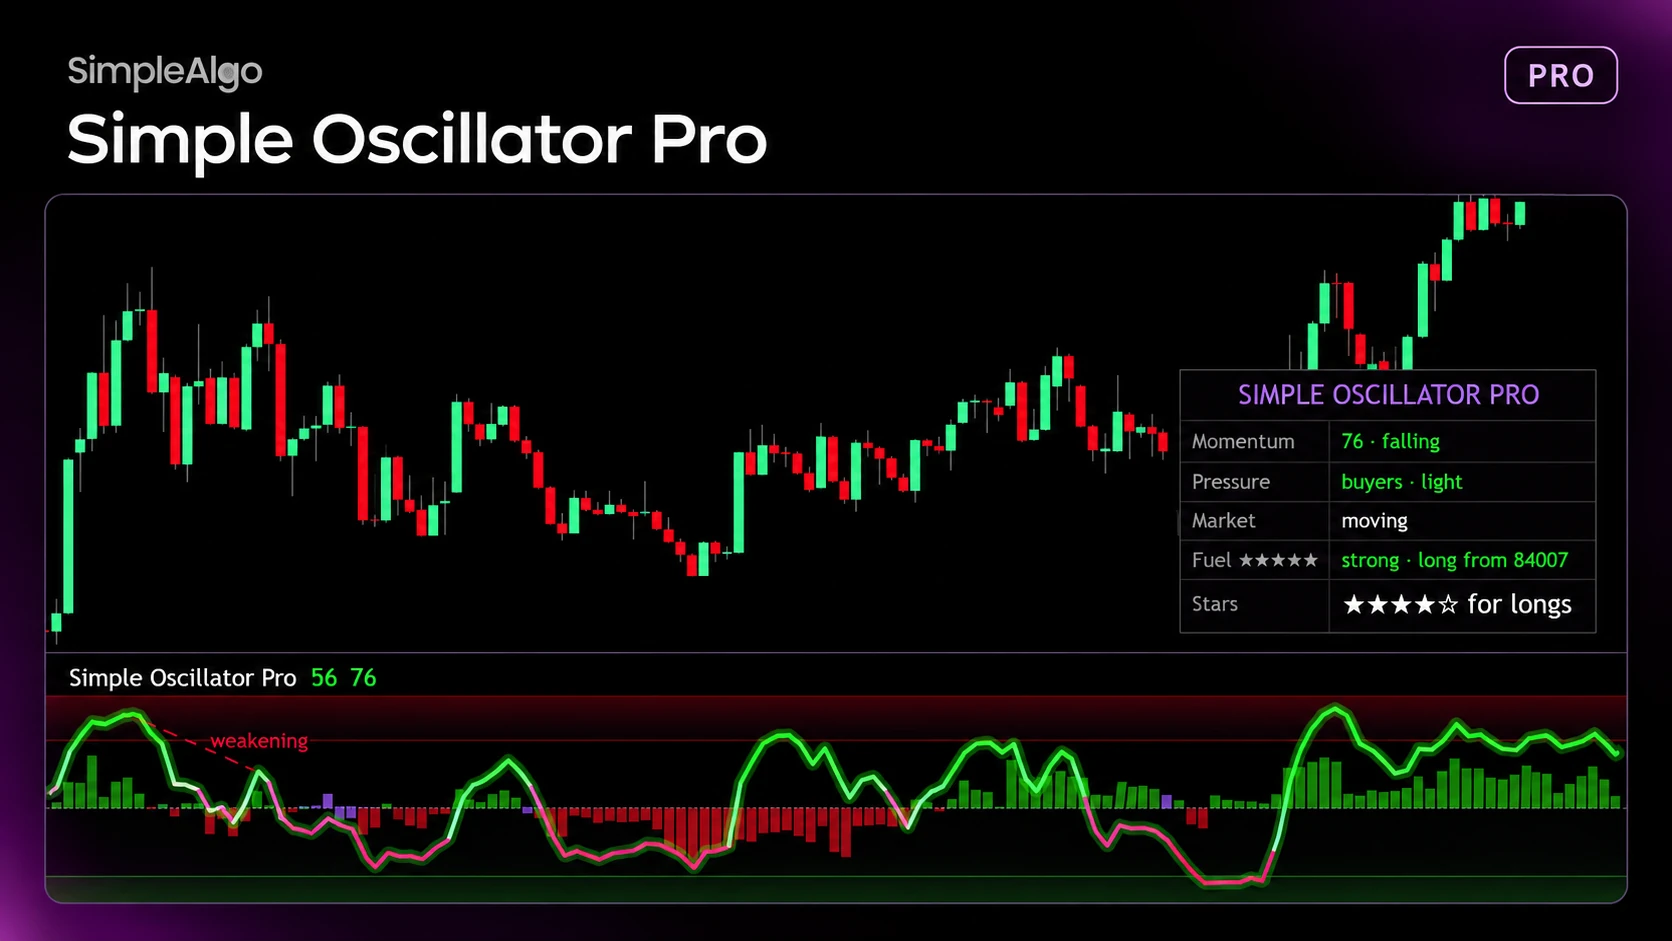
Introducing Simple Oscillator Pro: Is Momentum With You or Against You?
Simple Oscillator Pro is a brand new momentum indicator for premium members. One pane shows whether momentum is with you or against you, and how much fuel is left in your trade.
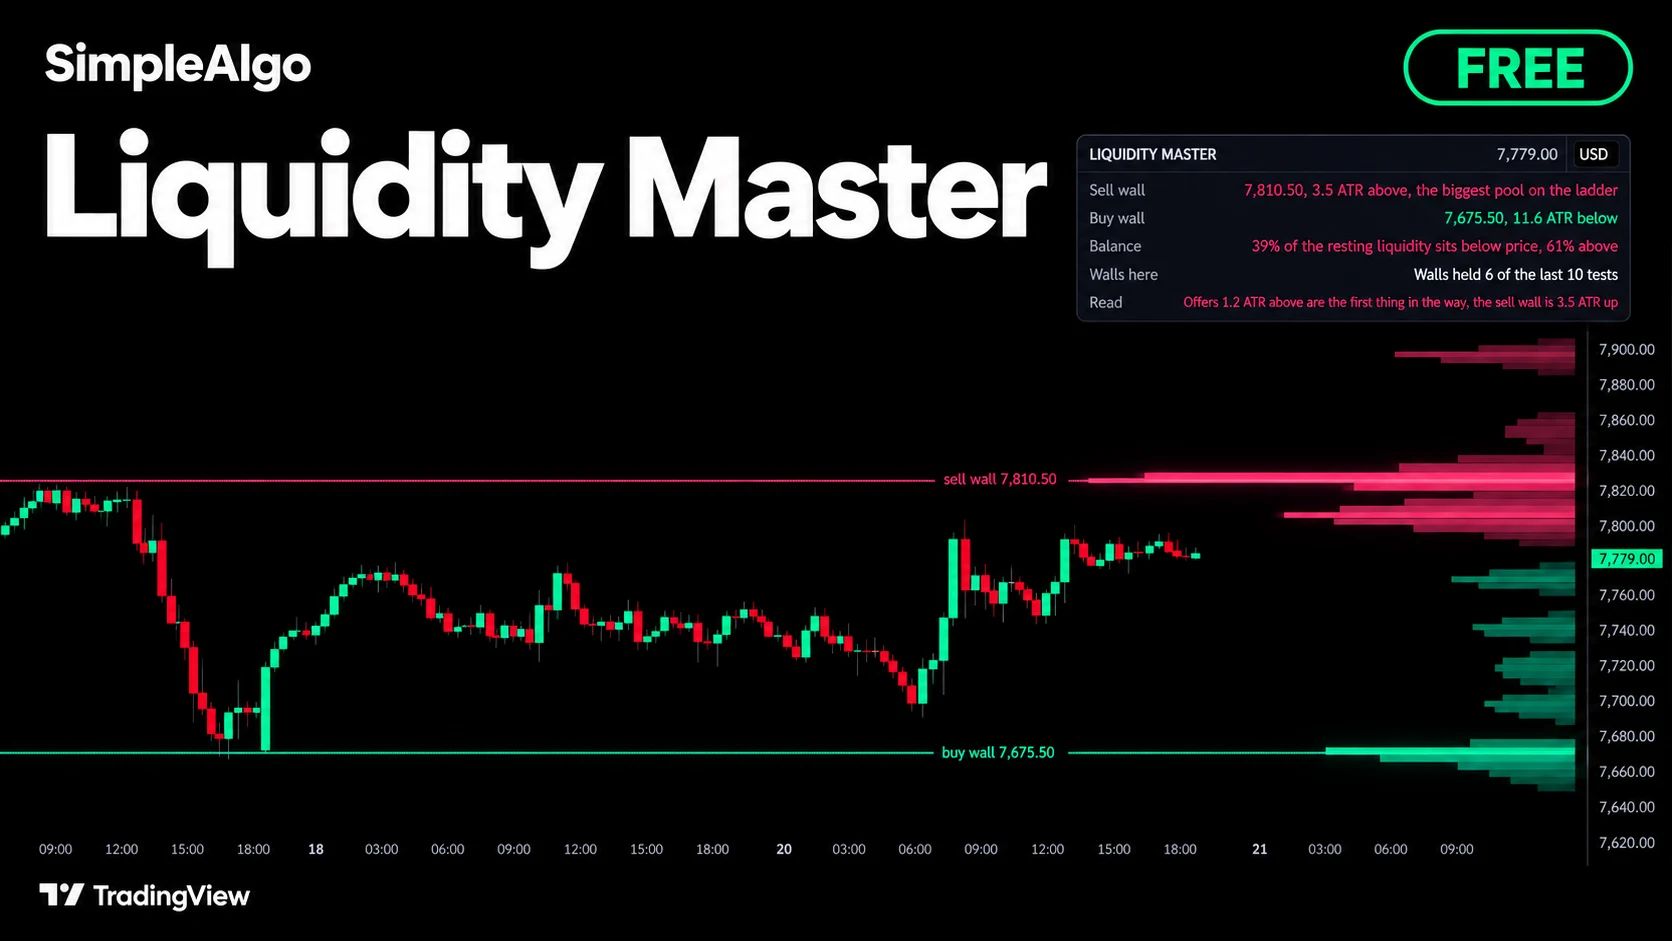
Introducing Liquidity Master: A Free Indicator That Maps the Order Book on Your Chart
Liquidity Master is a new free, open-source TradingView indicator. It maps where stops and resting orders sit, draws them as a depth ladder beside price, and keeps score of how the biggest walls hold.
Related tools and guides
Next steps on this topic from the rest of the SimpleAlgo library.