Introducing Fibonacci Master: A Free Auto Fibonacci Indicator That Keeps Score
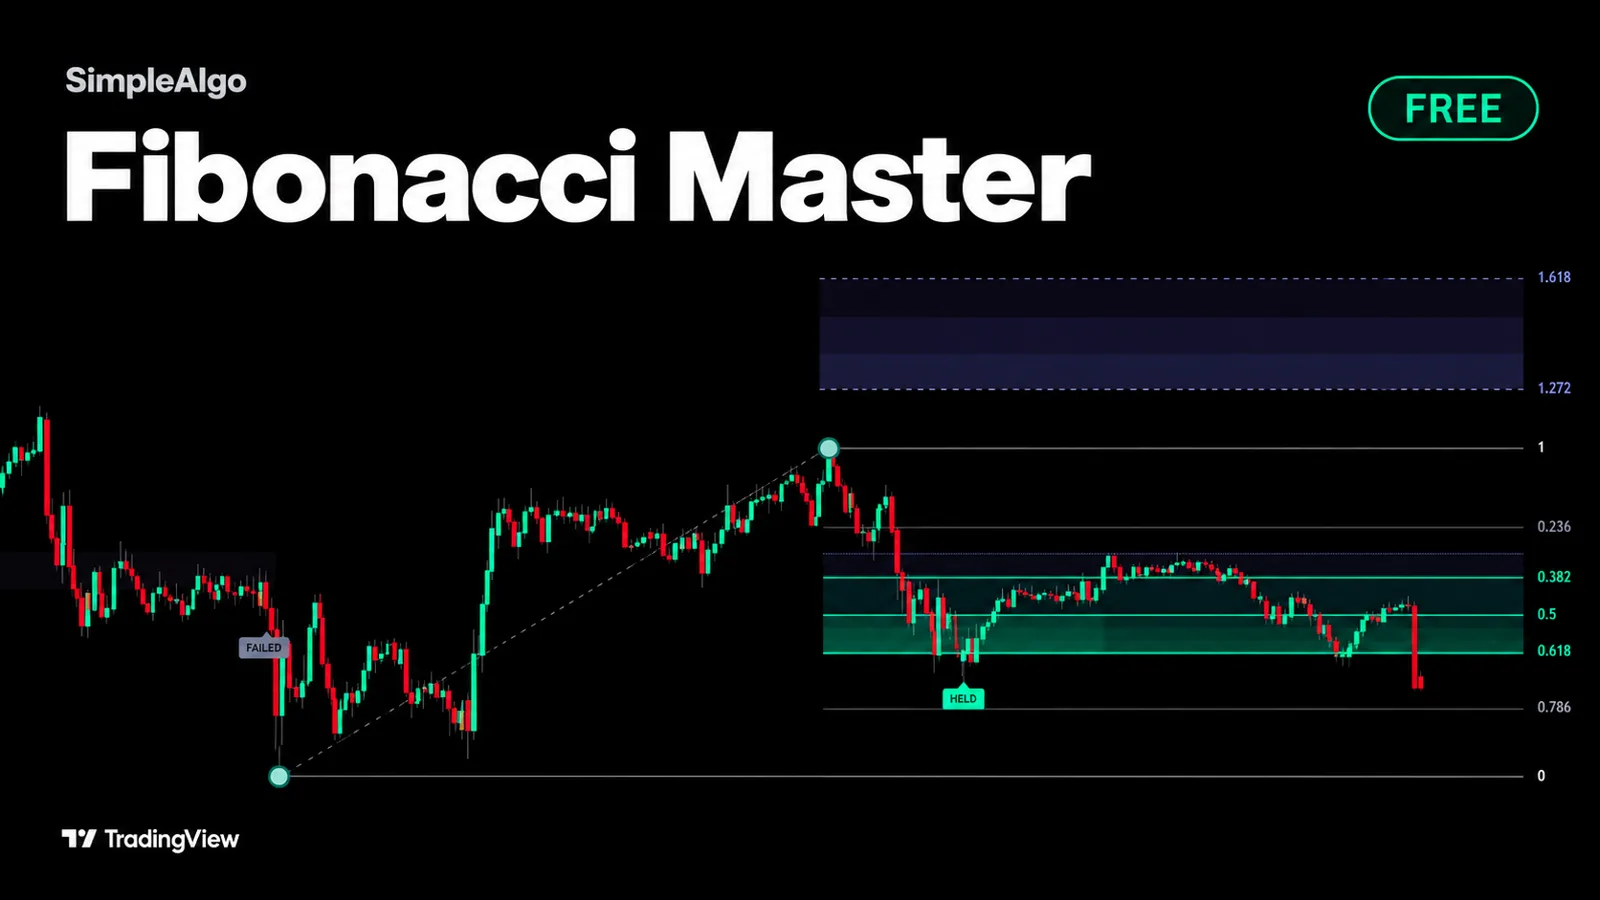
Fibonacci Master is a new free, open-source TradingView indicator. It draws the retracement for you, lights up the 0.5 to 0.618 zone, and measures where pullbacks actually end on your chart.
Introducing Fibonacci Master: A Free Auto Fibonacci Indicator That Keeps Score
We just released Fibonacci Master, a free and open-source indicator on TradingView.
Most traders draw a Fibonacci retracement by hand, pick a swing, and assume the 0.5 to 0.618 zone is where the pullback will end. Fibonacci Master draws it for you and then checks that assumption against the chart you're actually on.
What it draws
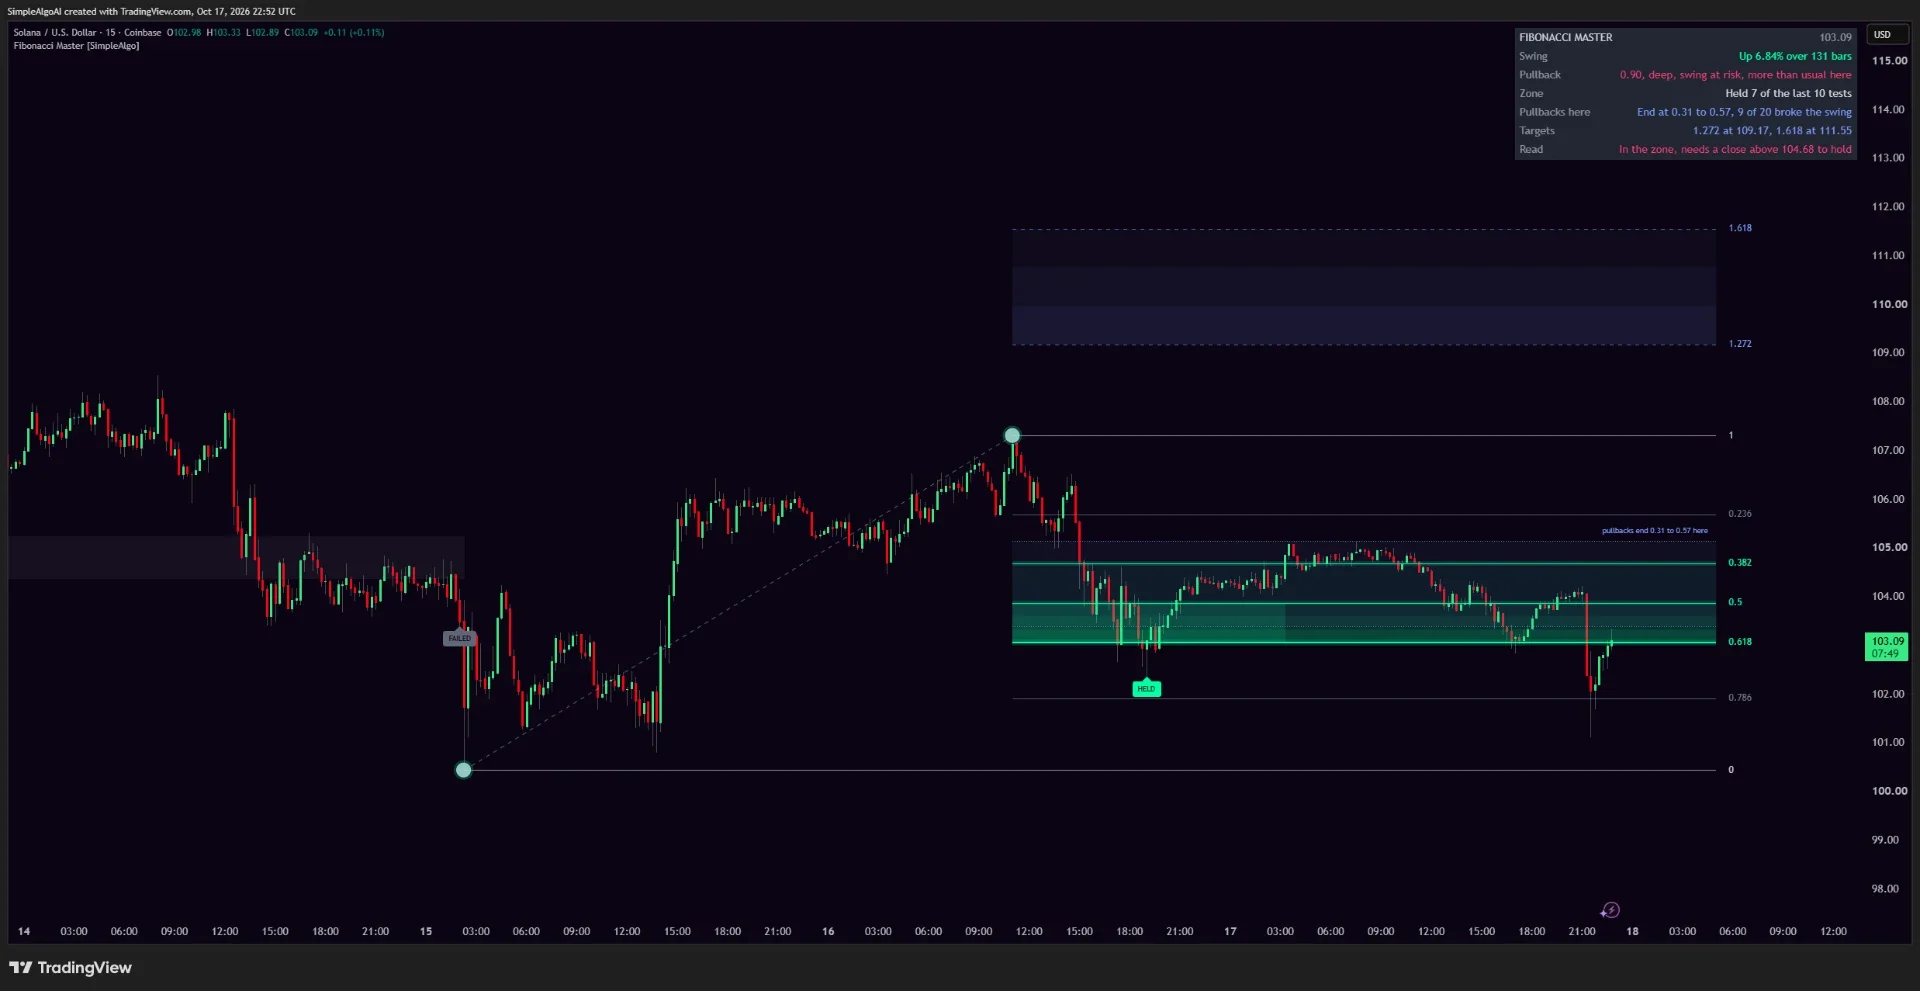
Fibonacci Master finds the swing that matters, sized in ATRs, and draws the levels from it: 0.236, 0.382, 0.5, 0.618 and 0.786. The 0.5 to 0.618 zone is lit up, and the 1.272 and 1.618 targets are projected beyond the swing.
When a pullback deep enough is followed by a new high, a fresh swing starts on its own. You never have to redraw anything.
It measures instead of assuming
Every pullback on the chart is recorded as a fraction of its swing. A dotted band beside the classic zone shows where the middle half of the last twenty pullbacks actually ended, along with how many went all the way and broke the swing. The textbook says 0.5 to 0.618. The band shows you what this market has done.
Every test is judged
Each pullback into the zone is a test, judged on closes, not wicks:
Tests are tagged, boxed and counted. A hold locks the swing so the targets stay put, and whether the 1.272 target was reached afterwards is counted too.
The panel and alerts
The panel in the corner says it all in words: the swing, how deep the pullback is, how many of the last ten tests held, where pullbacks end here, the targets, and one plain-English read such as "In the zone, needs a close above 104.68 to hold."
Six alerts cover the events: in the zone, zone held, zone failed, 1.272 hit, 1.618 hit and new swing. Set them to Once per bar close.
Fibonacci levels describe where pullbacks often end, not where they must. Use the record alongside the rest of your analysis.
Get it
Fibonacci Master is free for everyone, no membership needed. Add it on TradingView, or see it with the rest of our free and premium indicators.
Want every setting, the panel and the alerts explained? Read the full Fibonacci Master guide in the docs.
SimpleAlgo provides educational tools and chart analysis. Nothing here is financial advice. Trading involves substantial risk of loss, and past performance does not guarantee future results.
Written by
Nikolas MetreveliFounder of SimpleAlgo
Nikolas wrote his first real code at 12 and freelanced software tools and websites for small businesses before finding the markets at 15. He builds and maintains every SimpleAlgo indicator and writes these guides from hands-on use of the tools.
More about Nikolas and SimpleAlgoRelated Articles
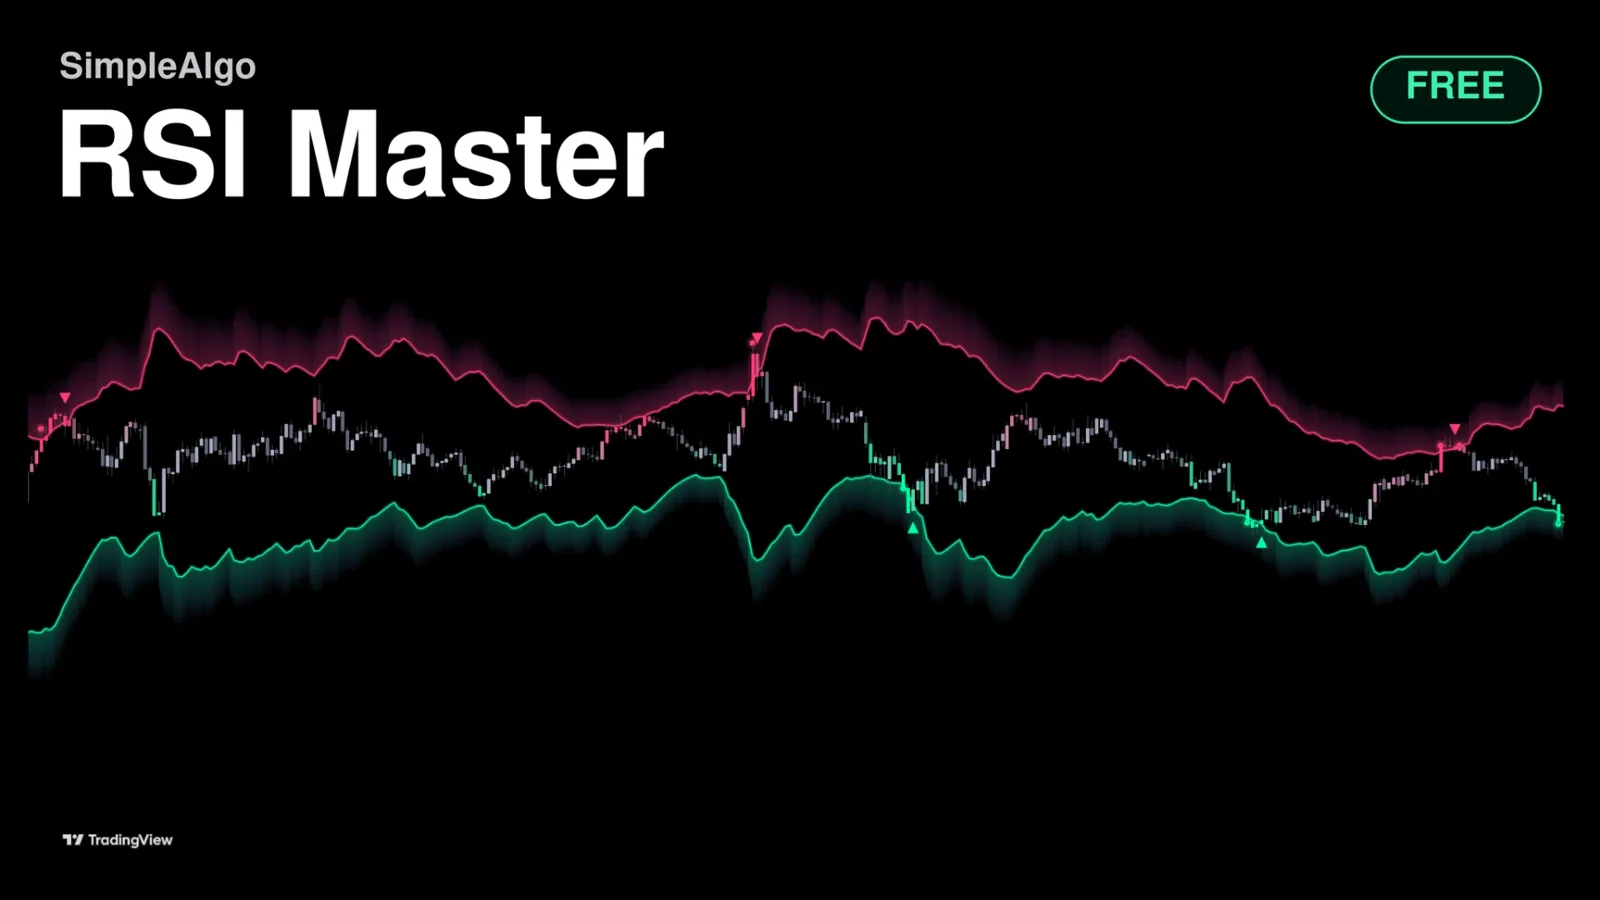
Introducing RSI Master: A Free RSI Indicator That Shows the Price
RSI Master is a new free, open-source TradingView indicator. It draws the exact prices where overbought and oversold begin, right on your chart.
Introducing Pullback Master: A Free Indicator That Counts and Grades Pullbacks
Pullback Master is a new free, open-source TradingView indicator. It finds the trend, counts every pullback that holds inside it, and tells you how deep each one went.
Introducing Stream Master: A Free Trend Indicator Drawn as a River
Stream Master is a new free, open-source TradingView indicator. It shows which way the market flows, how hard, how deep a turn has gone and how long the move has run.
Related tools and guides
Next steps on this topic from the rest of the SimpleAlgo library.