Fibonacci Master
The Fibonacci retracement, drawn for you and kept honest: levels from the swing that matters, the 0.5 to 0.618 zone, and targets.
About Fibonacci Master
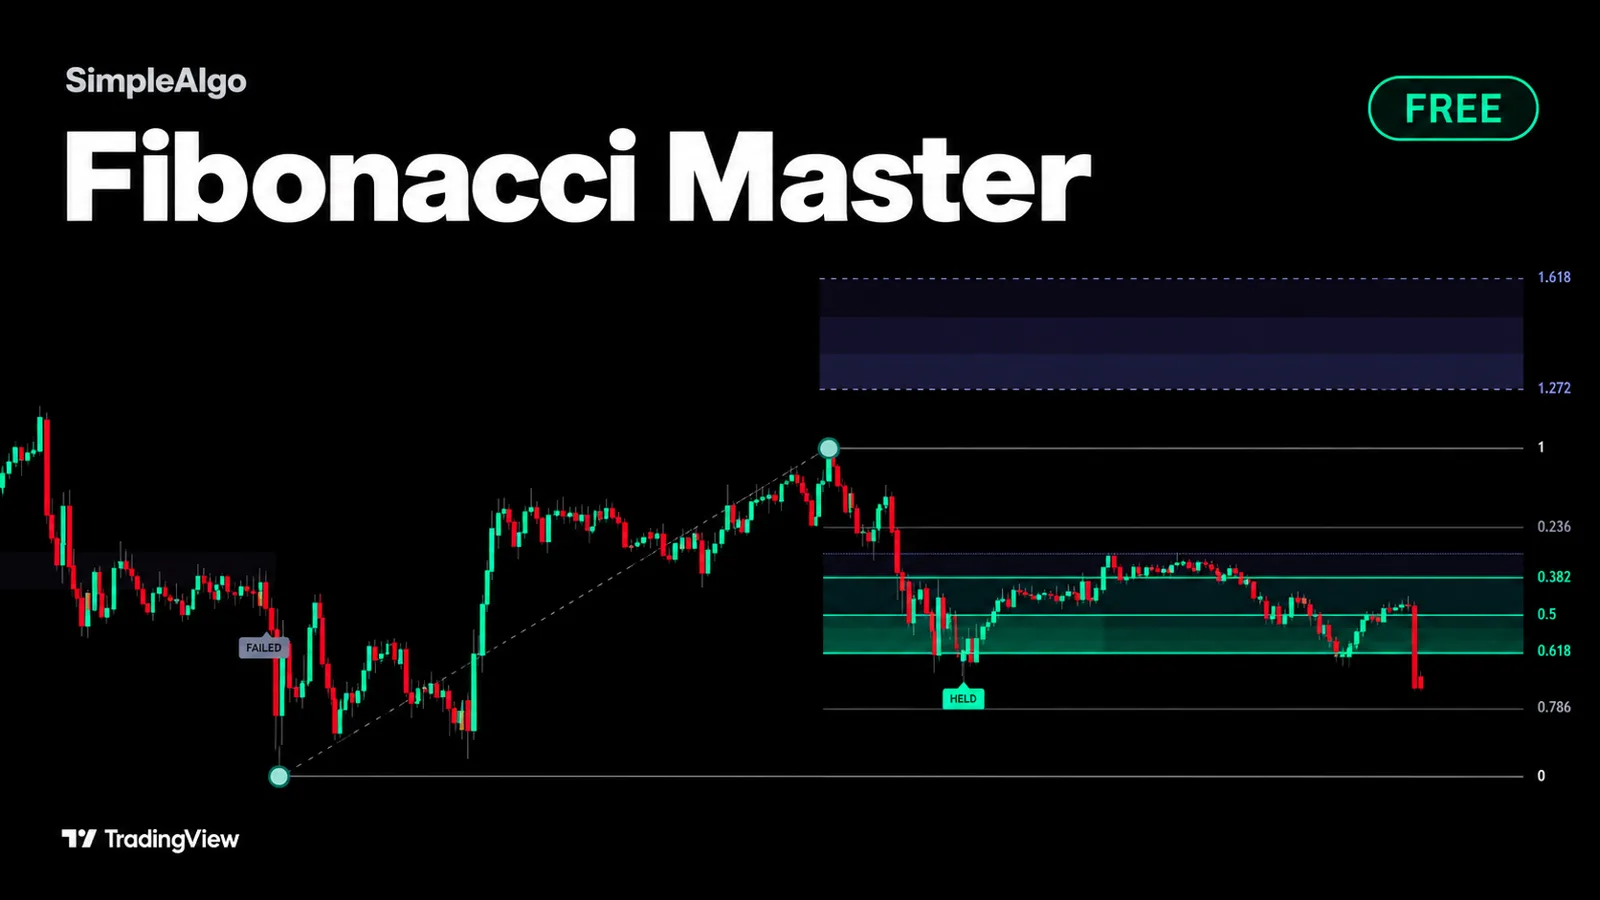
Fibonacci Master is a free, open-source Fibonacci retracement indicator for TradingView. It finds the swing that matters, draws the levels from it, lights up the 0.5 to 0.618 zone where pullbacks are supposed to end, and projects the 1.272 and 1.618 targets beyond the swing.
Then it measures instead of assuming. Every pullback on the chart is recorded as a fraction of its swing, so the chart carries its own answer to where pullbacks actually end, drawn as a dotted band beside the classic zone, along with how many went all the way and broke the swing.
Every pullback into the zone is a test, judged on closes: back past 0.382 and it held, past 0.786 and it failed. Tests are tagged, boxed and counted. The panel in the corner says it in words, and six alerts cover the events.
What it does
- Swing found automatically, sized in ATRs, with levels drawn from it
- The 0.5 to 0.618 zone lit up, plus 0.236, 0.382 and 0.786
- 1.272 and 1.618 targets projected beyond the swing
- A dotted band showing where pullbacks actually end on this chart
- HELD and FAILED tags, judged on closes, with past zones boxed
- Corner panel and six alerts, plus Neon, Classic, Aurora, Ice and Custom themes
- Free and open source on TradingView
- How the indicator finds the swing and draws the levels automatically
- The 0.5 to 0.618 golden zone and why it is highlighted
- The 1.272 and 1.618 extension targets
- What the HELD and FAILED tags on each pullback mean
Want the full suite?
Fibonacci Master is free forever. Premium members also unlock Pro Signals V5 and Simple Screener Pro, all granted straight to their TradingView account.
More free indicators
Profile Master
FreeA volume profile drawn as a cloud that travels with the chart, so you can see where value sits and how it moves.
Zone Master
FreeSupply and demand zones, kept honest: where price left in a hurry, how fast it left, how often it has been tested and how much of each zone is left.
Liquidity Master
FreeThe order book, read off the chart: where stops and resting orders sit, drawn as a depth ladder beside price, with the biggest walls named and tracked.