Introducing Volume Master: Every Candle Compared to Its Own Time of Day
Volume Master is a free, open-source TradingView indicator that draws volume as a mirrored sound wave, compares each candle against its own time of day, and flags gold wake-ups.
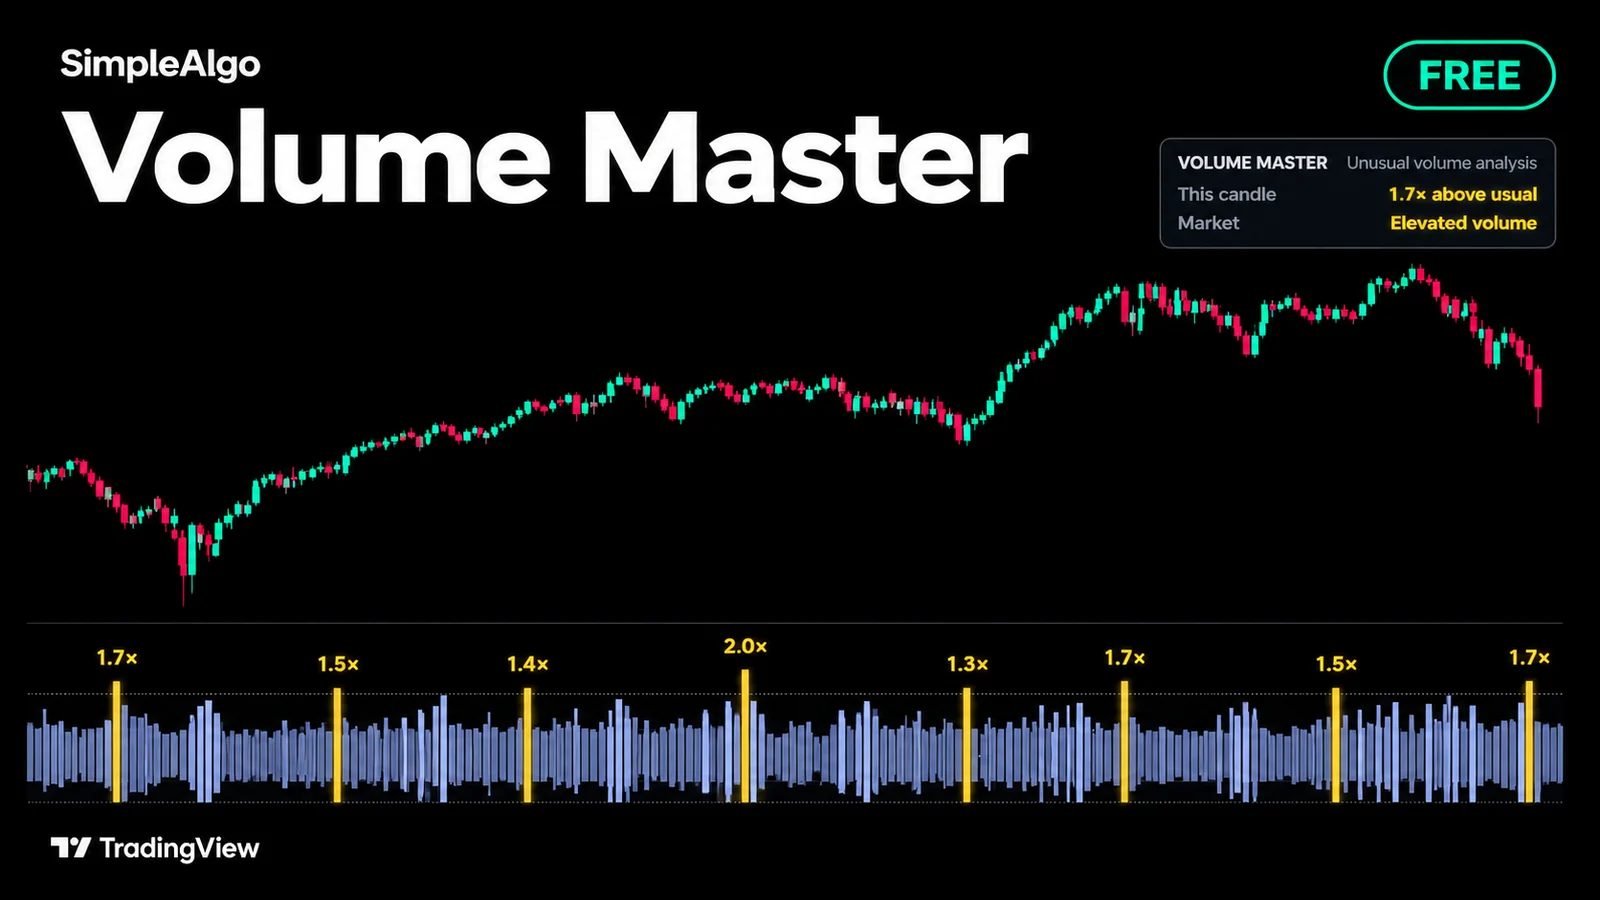
Introducing Volume Master: Every Candle Compared to Its Own Time of Day
A regular volume histogram has a built-in blind spot: markets are not equally busy all day. The opening candle routinely carries several times the volume of a midday or overnight bar, so a plain moving average calls every open a spike and misses unusual activity later in the session.
Volume Master fixes that comparison. It is free and open source on TradingView, so anyone can add it to a chart and read the code.
Time-of-day baseline, outlier trimmed
Instead of comparing a candle to the bars immediately before it, Volume Master compares each intraday candle to the same time slot across the last 20 sessions (for example, the 09:30 candle against the last twenty 09:30 candles). The single biggest session is left out of the average so one extreme day does not distort what counts as usual.
On daily charts and above, where there is one slot per day, it compares against the previous 20 candles.
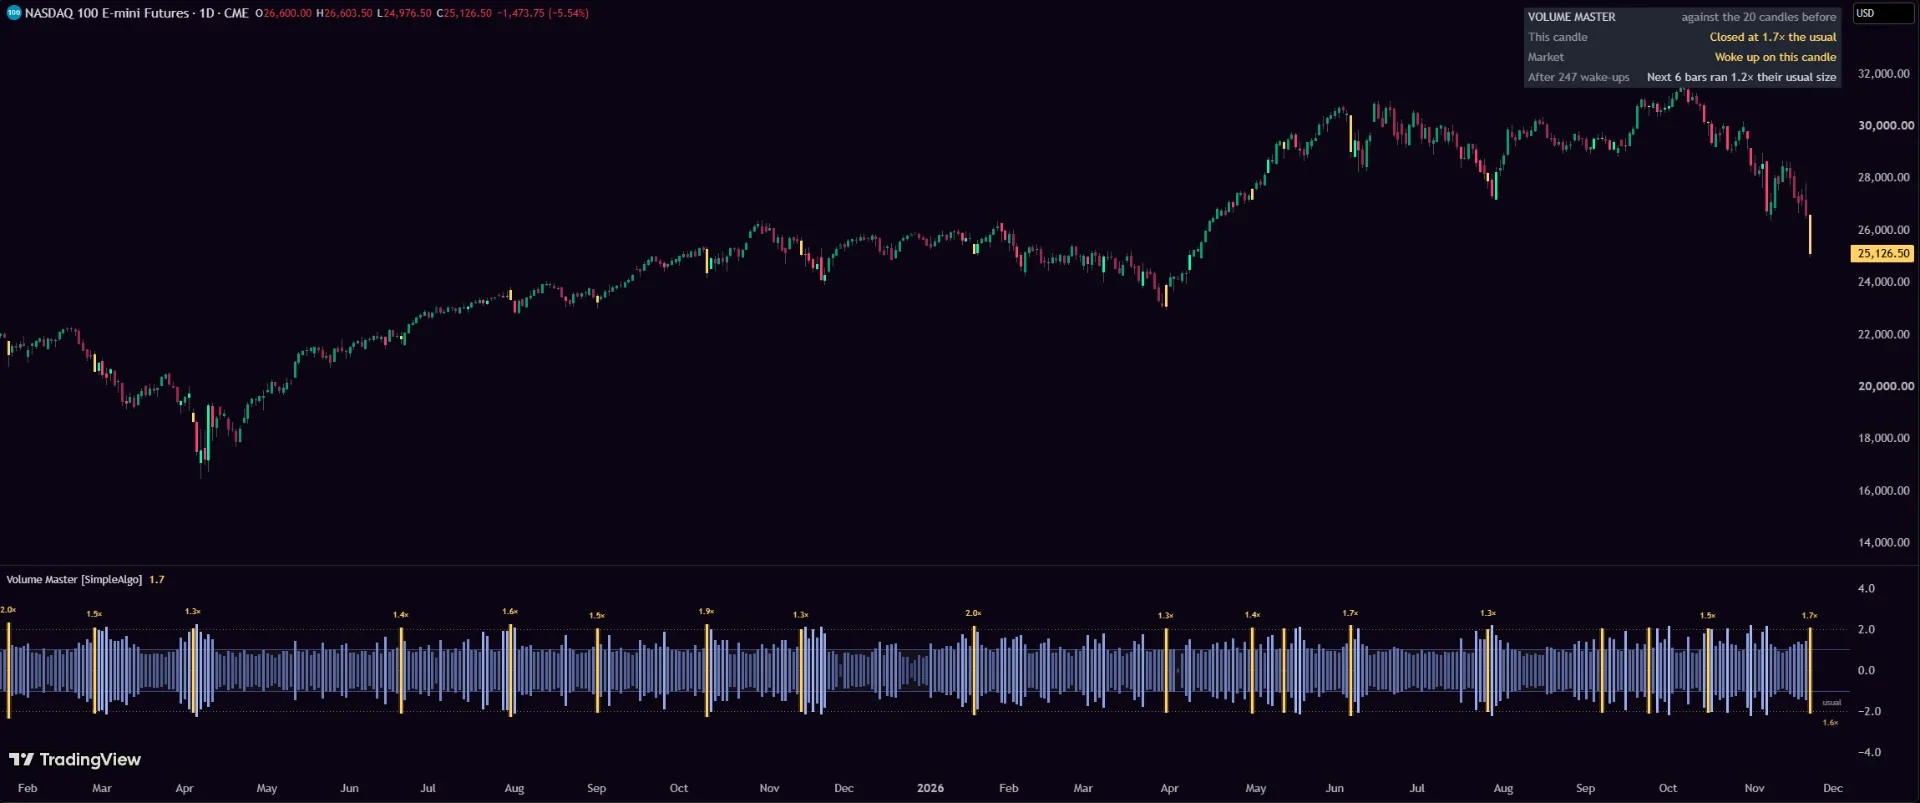
Volume drawn as a sound wave
The lower pane draws every candle's volume as a mirrored wave. The edge of the grey band marks the usual volume for that time of day, and the dotted line marks the 20-session high (the loud level).
A wave inside the band is at or under usual volume. A wave between the band and the dotted line is busier than usual. A wave through the dotted line is loud: more volume than that time of day had on any of the prior 20 sessions. Past the dotted line, the wave compresses smoothly toward a ceiling and brightens instead, so a quiet session and an extreme day remain readable on the same scale.
Gold wake-ups and the six-bar record
A wake-up is the first loud candle after six candles that were not loud. Its wave turns gold with its multiple of usual volume printed above it, its candle on the price chart turns gold, and a soft glow sits behind the six candles that follow.
The corner panel keeps a chart-specific record of how large the six candles after earlier wake-ups were compared to usual candle range for their time of day. It reports size only, never direction and never a promise about what comes next.
Live pace and volume-shaded candles
While an intraday candle (up to one hour) is still forming and at least one-third complete, an outlined extension on the last wave projects where volume is heading at its current pace. Once actual volume reaches the loud level, the wake-up mark is permanent because volume cannot shrink.
On the price chart, candles fade while the market is quieter than usual and return to full strength as participation builds. On intraday charts, the panel also names the busiest time of day on your chosen clock and counts down to it.
Settings and alerts
Start with the default 20 sessions. You can adjust the session lookback between 10 and 60, turn candle colouring or the six-bar glow on or off, choose your clock time zone, and customize wave and candle colours.
Four alert conditions cover Wake-up, Waking up (early, by pace), Loud candle, and Market went quiet. Use Once per bar close for confirmed alerts.
Get it free
Explore Volume Master. No SimpleAlgo membership is required.
For every setting, panel row, alert and limitation, read the Volume Master settings guide, or browse the indicator collection.
Volume tells you participation changed; it does not tell you which direction price will move. Always combine it with your own chart analysis and risk plan.
SimpleAlgo provides educational tools and chart analysis. Nothing here is financial advice. Trading involves substantial risk of loss, and past performance does not guarantee future results.

Written by
Nikolas MetreveliFounder of SimpleAlgo
Nikolas wrote his first real code at 12 and freelanced software tools and websites for small businesses before finding the markets at 15. He builds and maintains every SimpleAlgo indicator and writes these guides from hands-on use of the tools.
More about Nikolas MetreveliRelated Articles
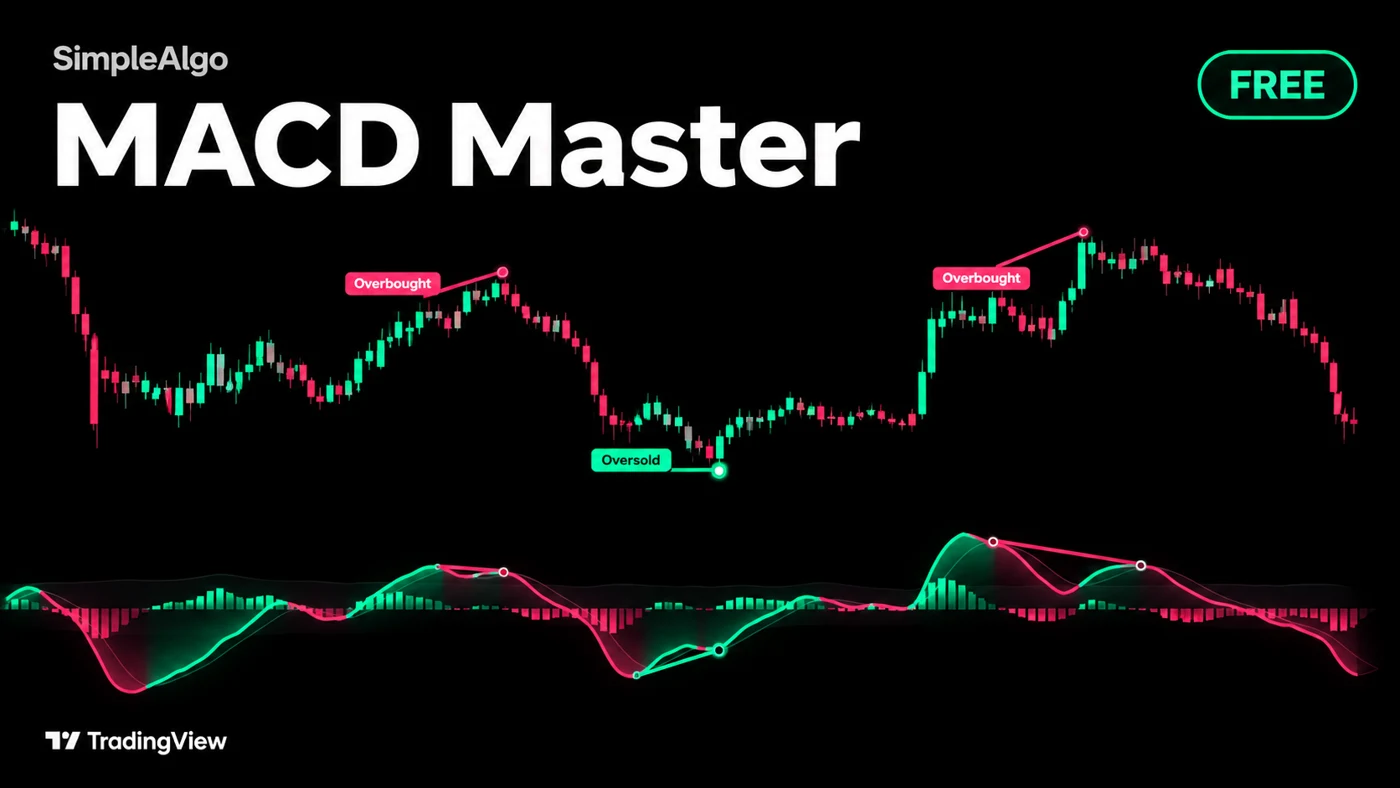
Introducing MACD Master: The Classic MACD, With the Next Cross in Price
MACD Master is a free, open-source TradingView indicator with filtered signals, exact next cross price, wave-to-wave divergences and a conditional cross clock.
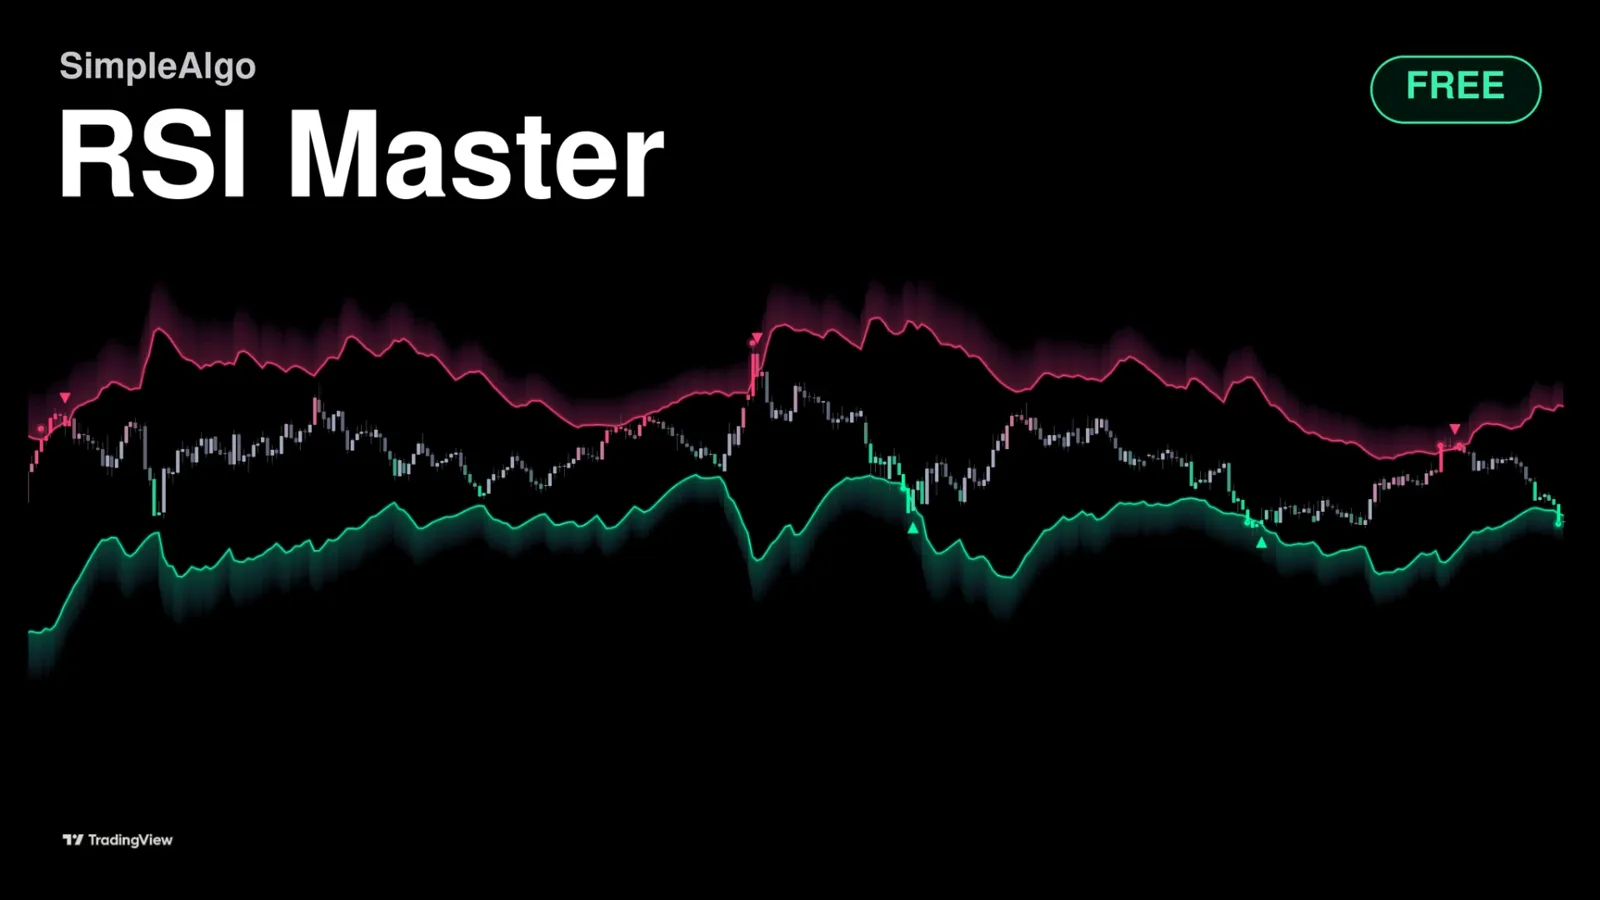
Introducing RSI Master: A Free RSI Indicator That Shows the Price
RSI Master is a new free, open-source TradingView indicator. It draws the exact prices where overbought and oversold begin, right on your chart.
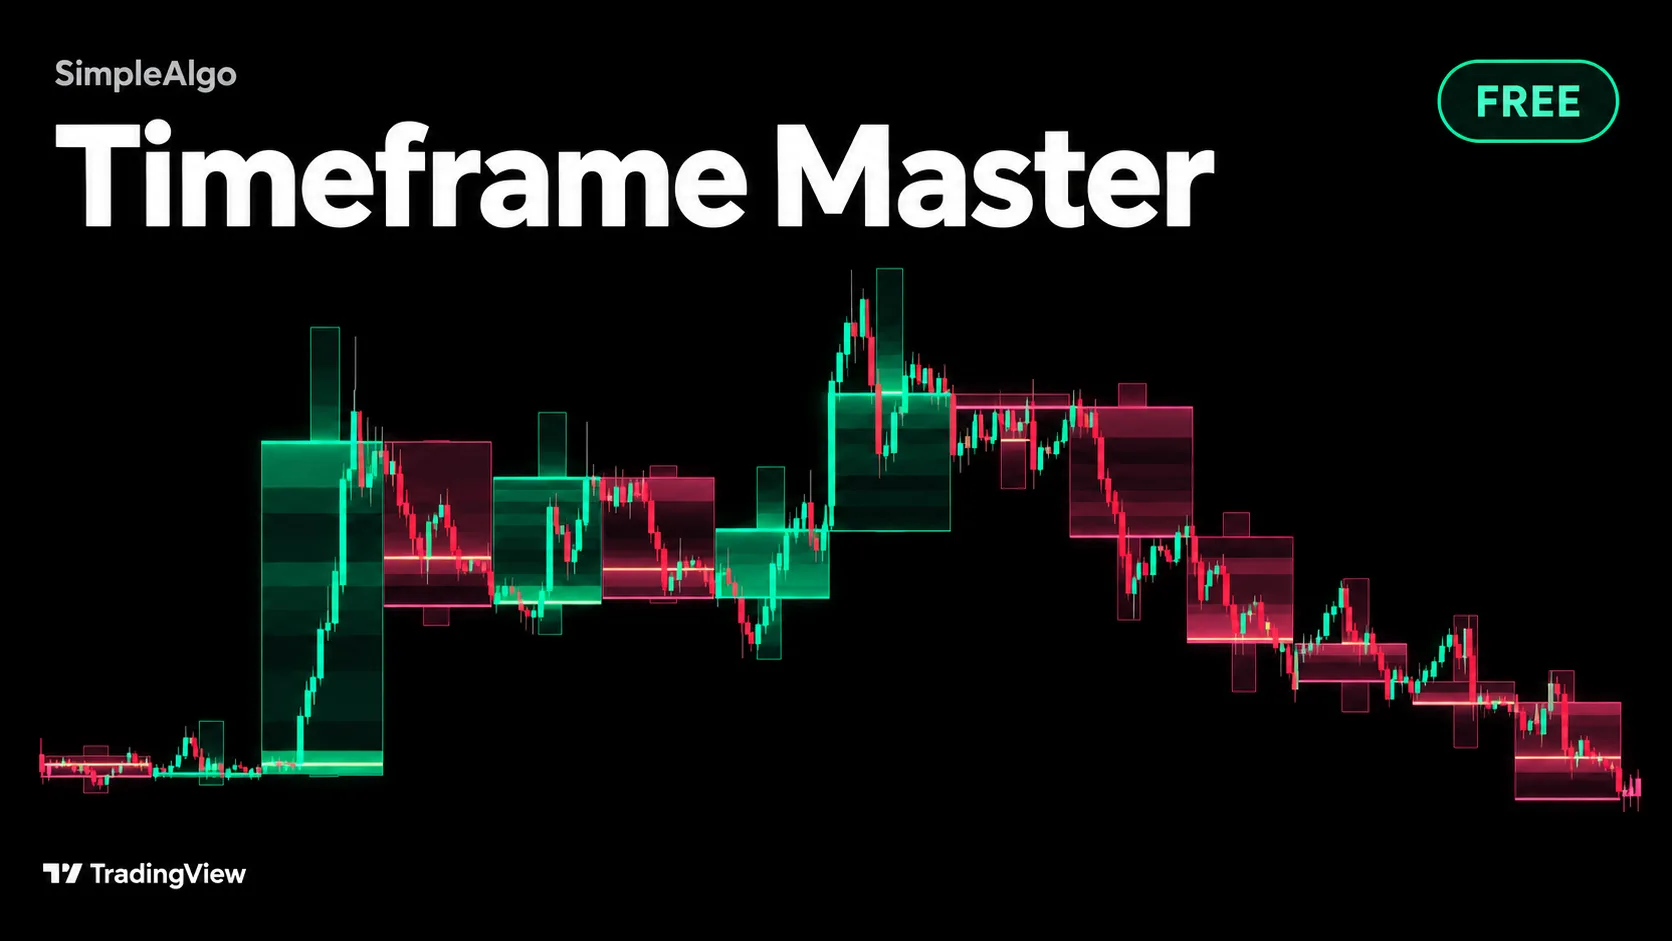
Timeframe Master: Free Higher Timeframe Candles for TradingView
Timeframe Master is our newest free, open-source TradingView indicator. It draws the candle one timeframe up behind your chart, lit by where price spent its time.
Related tools and guides
Next steps on this topic from the rest of the SimpleAlgo library.