Introducing MACD Master: The Classic MACD, With the Next Cross in Price
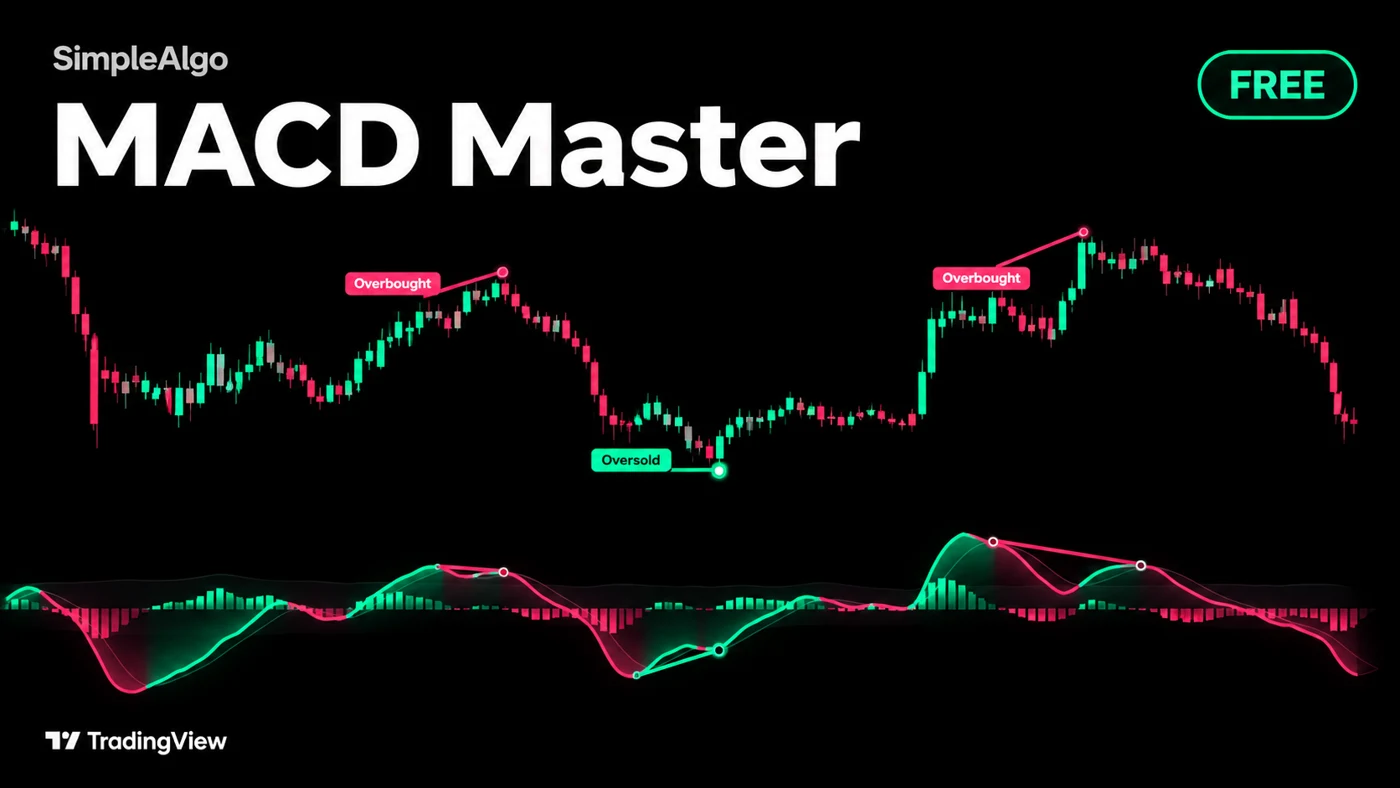
MACD Master is a free, open-source TradingView indicator with filtered signals, exact next cross price, wave-to-wave divergences and a conditional cross clock.
Introducing MACD Master: The Classic MACD, With the Next Cross in Price
MACD shows when two moving averages are pulling apart or coming together. The question a trader often has is more concrete: which closing price would make the next cross happen?
MACD Master answers that on the chart. It is free and open source, so anyone can add it and inspect the code.
The familiar MACD, kept intact
The calculation is the classic one: a 12 EMA of close minus a 26 EMA of close, a 9 EMA signal line, and their gap as the histogram. Nothing replaces the standard MACD.
Four colours distinguish momentum up and building, up and fading, down and building, and down and fading. Optional candle colours carry the same read onto price.
Not every cross is a signal
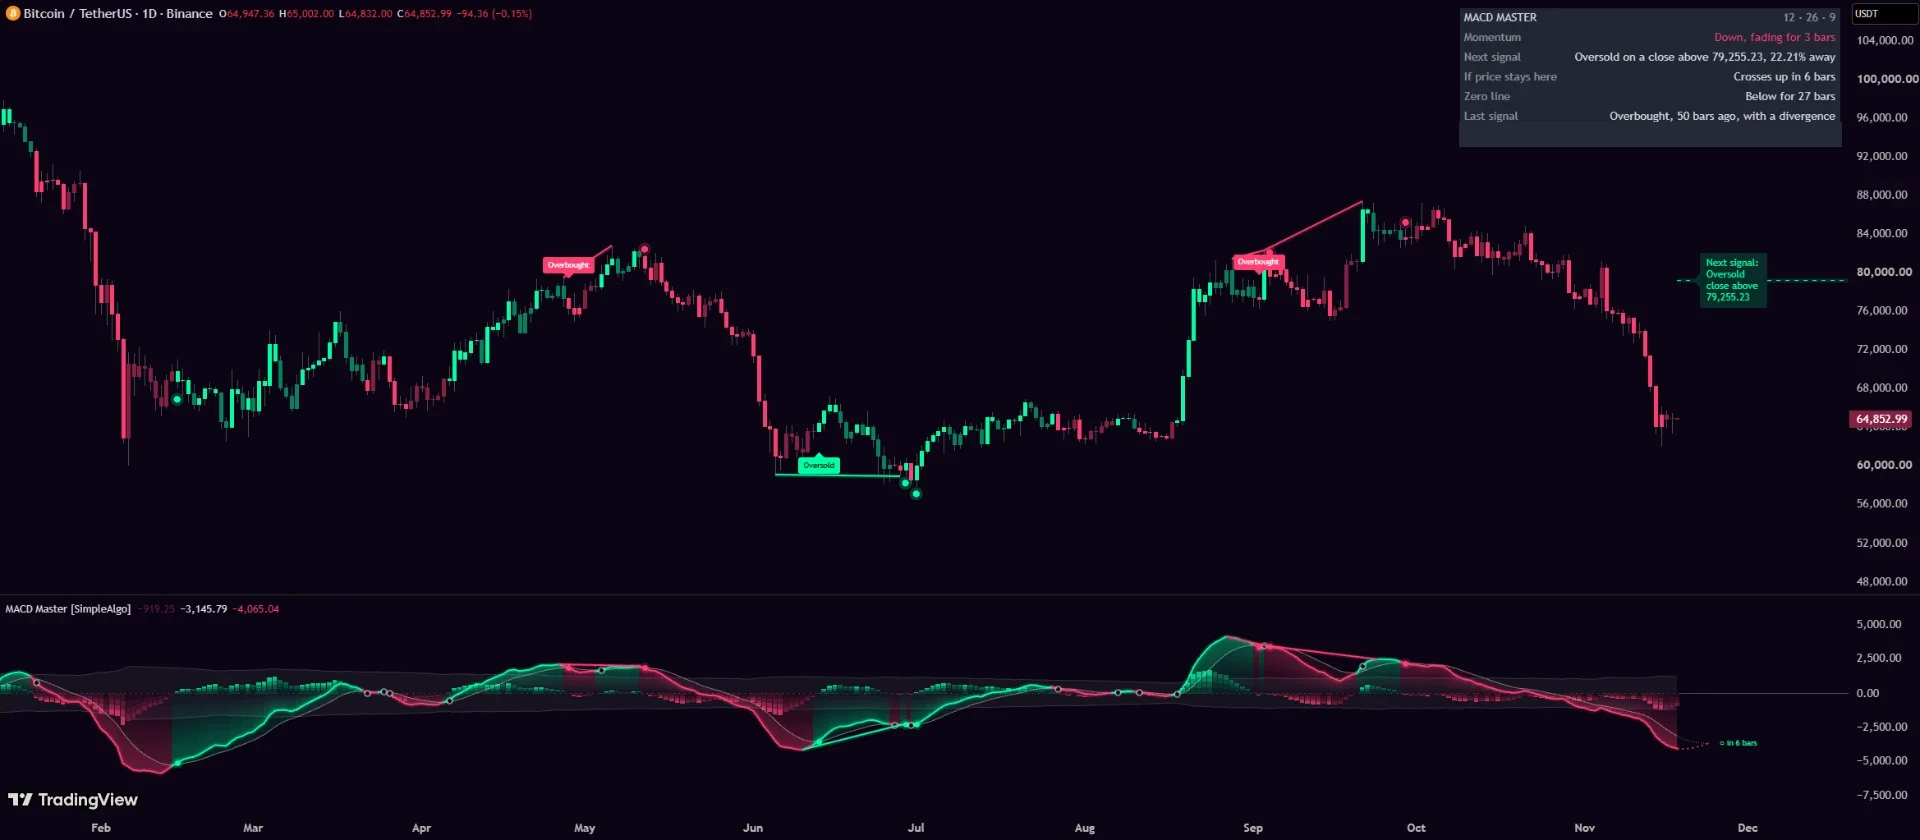
MACD Master highlights crosses back toward zero from outside a grey, ATR-based band. An up cross from below the band is labelled Oversold; a down cross from above it is Overbought. Other crosses remain hollow rings in the pane.
You can switch the words to Buy and Sell, or use dots. The rules stay the same. Signals confirm on the candle close, and repeated same-direction signals become dots instead of repeated labels.
The next cross, expressed as a price
The dashed line on the chart is the exact close needed for MACD to meet its signal line, solved from the EMA formula. It reads Next signal if that cross would also pass the band filter.
While a candle forms, the threshold applies to that candle. After it closes, the threshold is recalculated for the next one. It is not a price target or a level expected to hold, and a wick touching it does not confirm a signal.
Divergence, wave to wave
Every stretch MACD spends below signal has a lowest MACD value and a lowest price low. A completed wave with a lower price low but a higher MACD low than the previous down wave is bullish divergence. Higher price highs with lower MACD highs give the bearish mirror.
Lines appear only when the ending cross candle closes. They connect the earlier extremes then: the divergence was not known at those earlier candles. Once drawn, they are not redrawn.
A clock with an explicit assumption
The cross clock carries MACD and signal forward as if every coming candle closed at the latest price. It looks up to twenty bars ahead and shows when the lines would meet under that assumption.
This is a conditional calculation, not a forecast. If price changes, the answer changes.
Settings and alerts
Keep 12, 26 and 9 to start. A wider band filters more signals; turning it down makes more crosses qualify. Choose Mint and Pink, Ice, Neon or your own colours, and hide any tools you do not need.
Ten alert conditions cover filtered signals, all crosses, divergences, price reaching the threshold, zero-line crosses and momentum starting to fade. Use Once per bar close for confirmed readings.
Get it free
Add MACD Master on TradingView. No SimpleAlgo membership is required.
For every input, panel row, alert and limitation, read the MACD Master settings guide, or browse the indicator collection.
A signal says momentum has turned. It does not say where price goes next. MACD lags price, and ranging markets can produce repeated crosses. Use it with your own analysis and risk plan.
SimpleAlgo provides educational tools and chart analysis. Nothing here is financial advice. Trading involves substantial risk of loss, and past performance does not guarantee future results.

Written by
Nikolas MetreveliFounder of SimpleAlgo
Nikolas wrote his first real code at 12 and freelanced software tools and websites for small businesses before finding the markets at 15. He builds and maintains every SimpleAlgo indicator and writes these guides from hands-on use of the tools.
More about Nikolas and SimpleAlgoRelated Articles
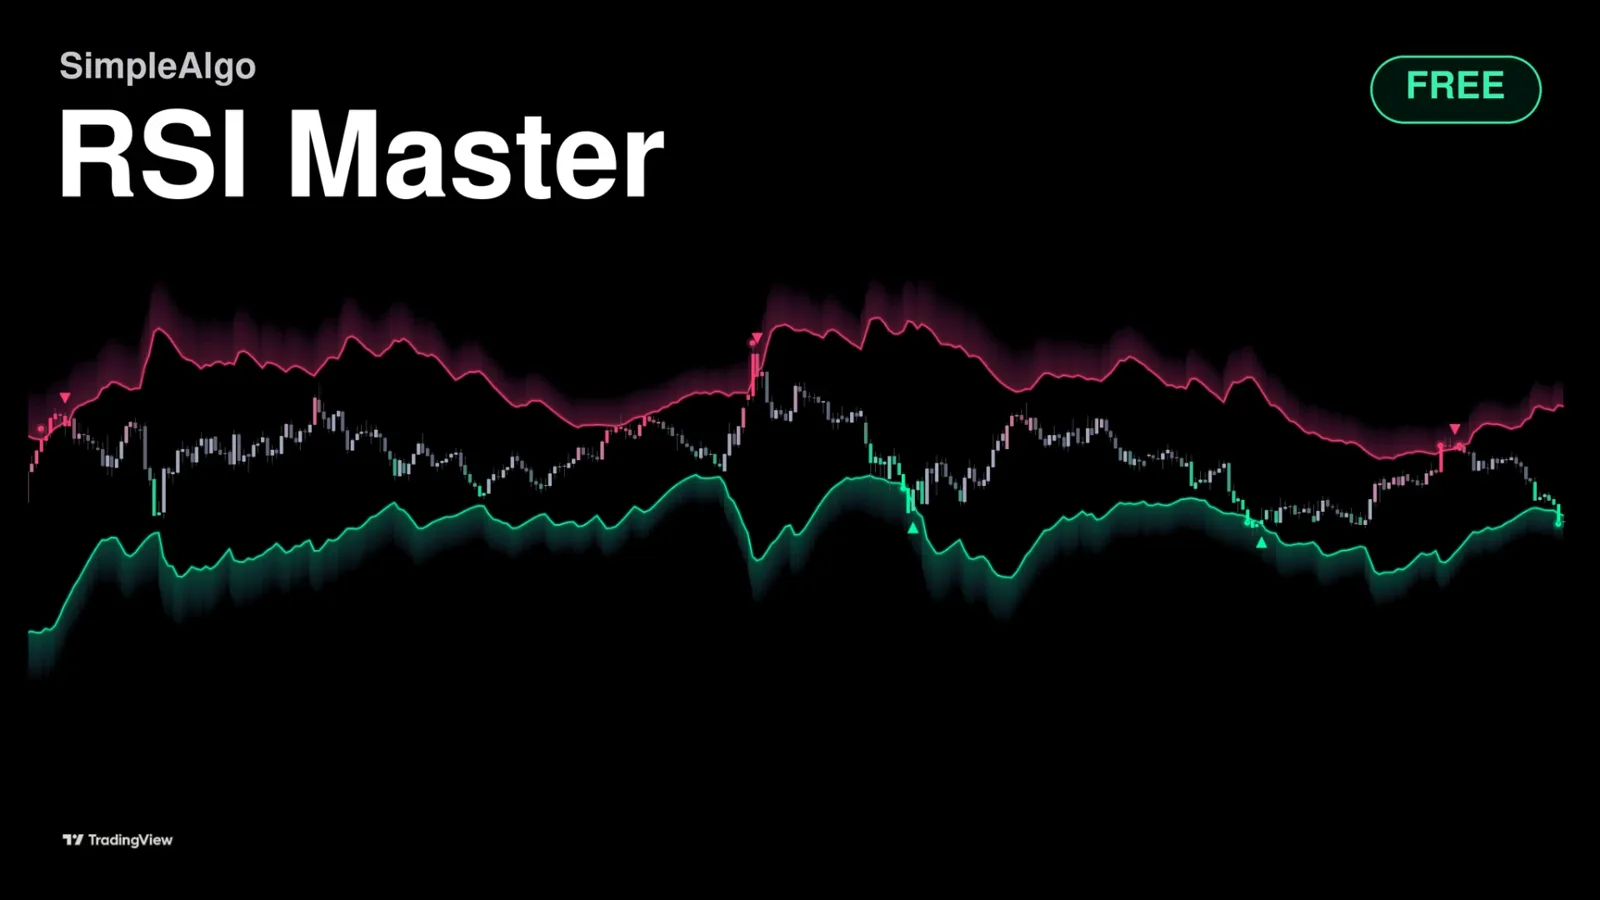
Introducing RSI Master: A Free RSI Indicator That Shows the Price
RSI Master is a new free, open-source TradingView indicator. It draws the exact prices where overbought and oversold begin, right on your chart.

MACD Divergence Trading: Spot Reversals Before They Happen
Learn to identify bullish and bearish divergences using MACD. This powerful technique helps you spot trend reversals before price confirms them.
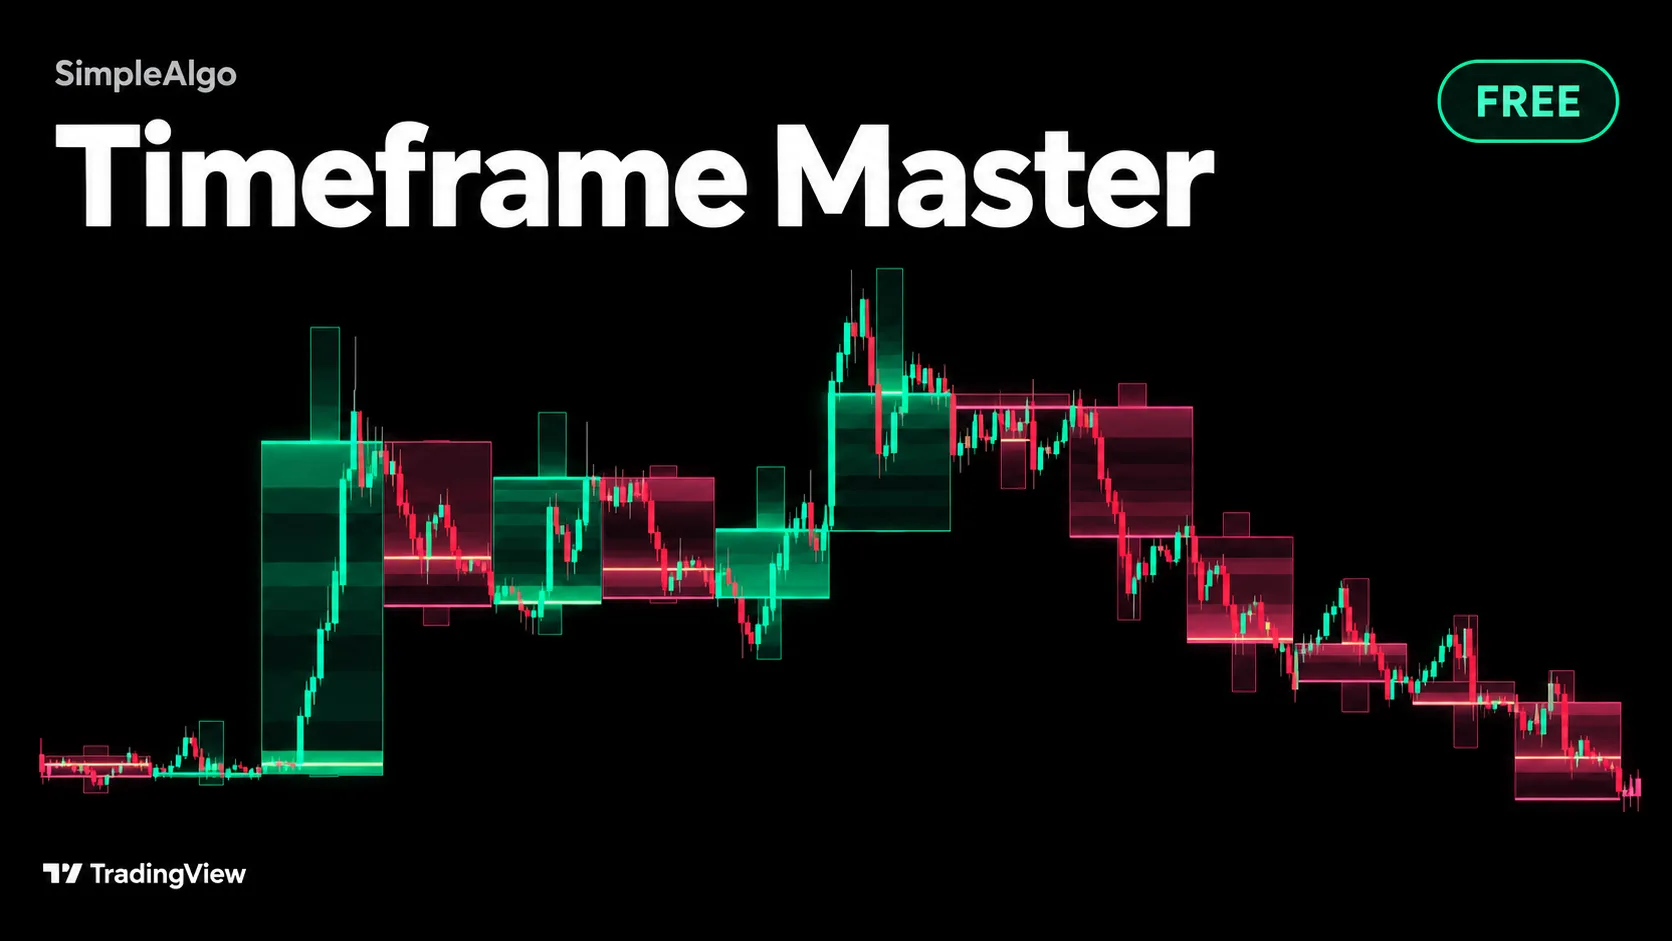
Timeframe Master: Free Higher Timeframe Candles for TradingView
Timeframe Master is our newest free, open-source TradingView indicator. It draws the candle one timeframe up behind your chart, lit by where price spent its time.
Related tools and guides
Next steps on this topic from the rest of the SimpleAlgo library.