Timeframe Master
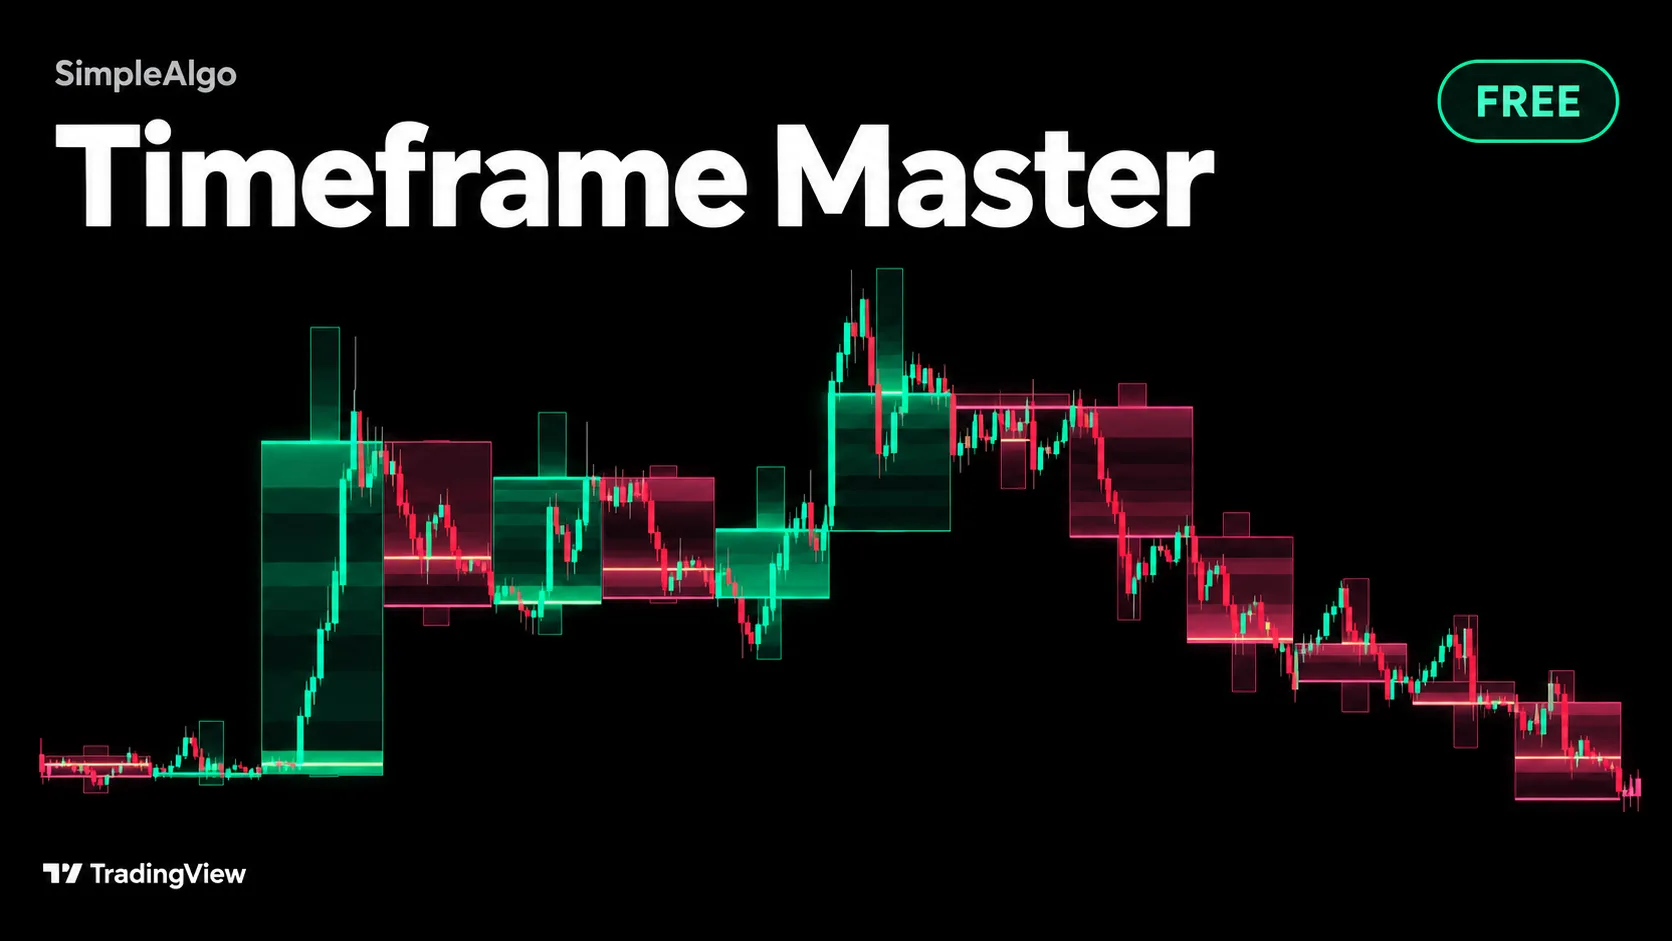
The candle one timeframe up, drawn behind your chart, with every row lit by where price spent its time.
About Timeframe Master
Timeframe Master is a free, open-source indicator that draws the bigger candle behind your chart. On a 5 minute chart that is the 1 hour candle, on a 1 hour chart the daily candle, on a daily chart the monthly candle.
Each bigger candle is built from your chart's own bars. Nothing is requested from another timeframe and nothing looks ahead.
Every candle is drawn as a lantern: rows from its low to its high glow by how many bars traded there, and the busiest row, the core, gets a line. The candle still forming sits inside a dashed outline out to where it is due to close, and a small panel puts it all into words.
What it does
- Auto picks the right bigger timeframe for your chart
- Lantern rows show where price spent its time
- Core line marks the busiest price of each candle
- Dashed outline for the candle still forming
- Panel in plain words, plus three alerts
- Mint and Pink, Ice, Neon or custom colours
- Free and open source on TradingView
Want the full suite?
Timeframe Master is free forever. Premium members also unlock Pro Signals V5 and Simple Screener Pro, all granted straight to their TradingView account.
More free indicators
Profile Master
FreeA volume profile drawn as a cloud that travels with the chart, so you can see where value sits and how it moves.
Zone Master
FreeSupply and demand zones, kept honest: where price left in a hurry, how fast it left, how often it has been tested and how much of each zone is left.
Liquidity Master
FreeThe order book, read off the chart: where stops and resting orders sit, drawn as a depth ladder beside price, with the biggest walls named and tracked.