Most Traders Use RSI Wrong. Here's How to Actually Use It.
RSI above 70 does not mean sell, and below 30 does not mean buy. Learn to read momentum, trend context and price thresholds with real chart examples.
Almost every trader has used RSI.
And almost every beginner learns the same two rules:
RSI above 70 = Sell.
RSI below 30 = Buy.
There's just one problem.
That's not how RSI works.
An overbought market can keep going higher. An oversold market can keep falling.
And traders who blindly buy or sell at these levels often end up fighting the strongest trends.
RSI isn't a bad indicator. But understanding what it's actually telling you makes a huge difference.
Let's break it down.
Overbought Doesn't Mean Price Has to Fall
The Relative Strength Index (RSI) measures the strength of recent price movements on a scale from 0 to 100.
Traditionally:
But here's what many traders misunderstand.
Overbought means momentum has been strong. It doesn't mean buyers have disappeared.
Imagine a stock breaking through a major resistance level with strong volume.
RSI crosses 70.
Some traders immediately start looking for shorts because they believe the market is now "too expensive."
Meanwhile, the breakout continues, new buyers enter, and RSI stays elevated.
The indicator wasn't necessarily wrong.
The interpretation was.
In strong uptrends, RSI can remain elevated as price continues higher. In strong downtrends, oversold readings can persist while price keeps falling.
A better question isn't "Is RSI overbought?"
It's "Why is RSI overbought, and what is price doing?"
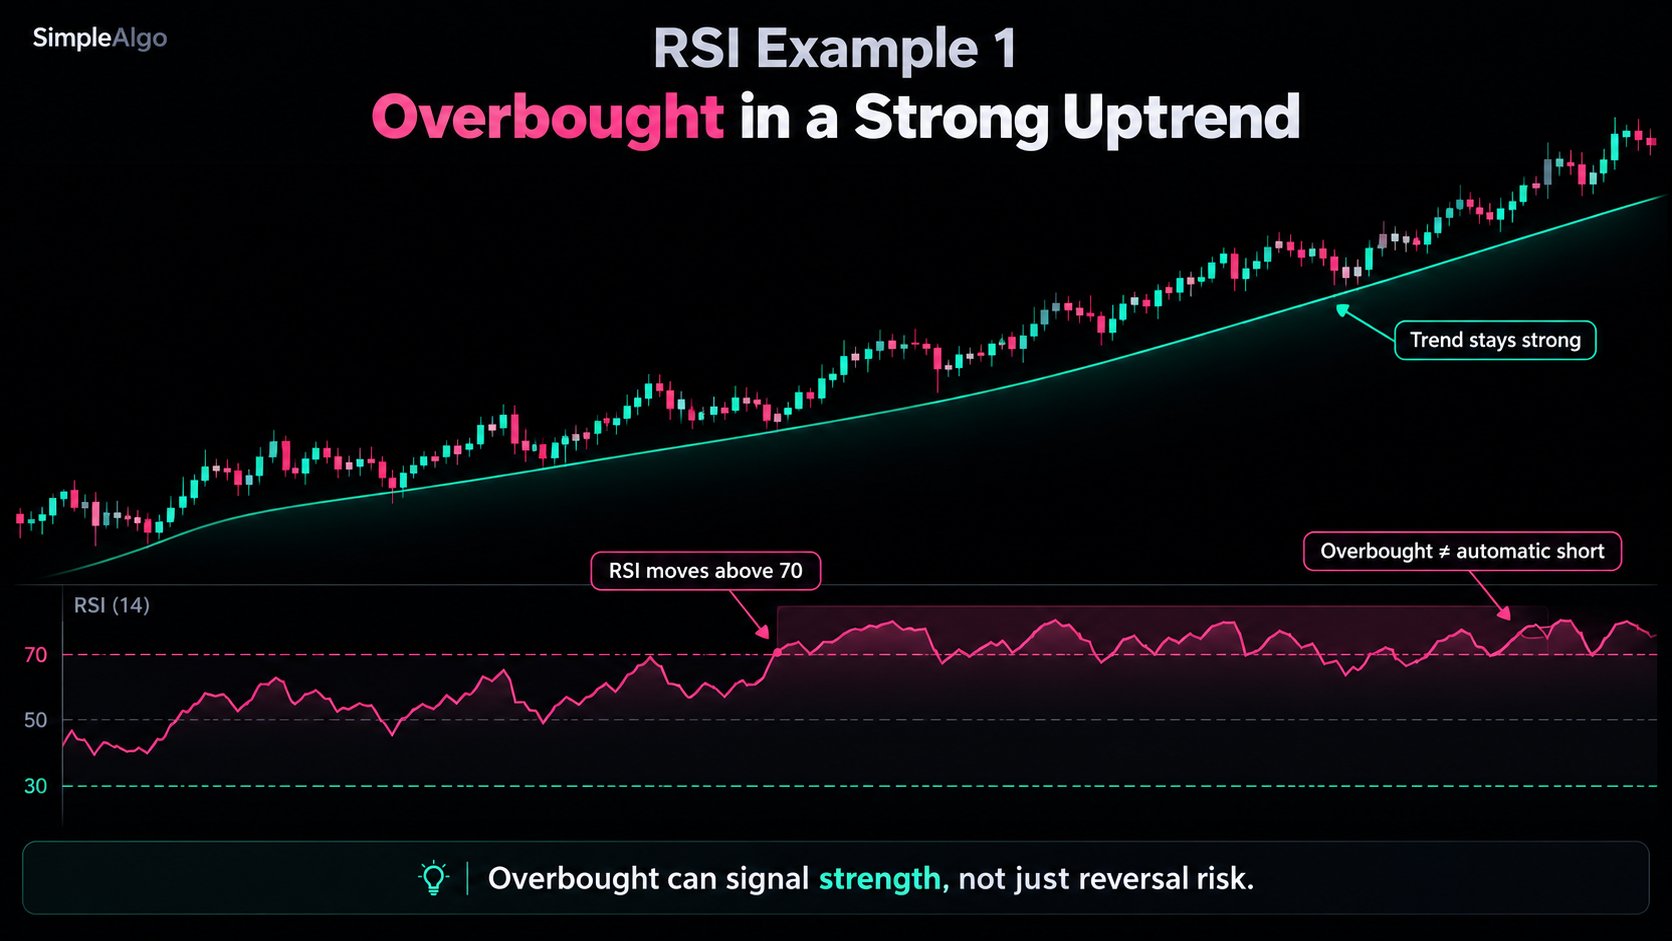
RSI crossing above 70 doesn't automatically signal a reversal. During strong uptrends, momentum can remain elevated while price continues making higher highs.
The Trend Changes Everything
The same RSI reading can mean different things depending on market conditions.
In an uptrend:
An overbought reading may reflect strong bullish momentum.
Instead of automatically shorting, watch how RSI behaves during pullbacks. If momentum cools while price holds an important support level, the broader trend may still be intact.
In a downtrend:
An oversold reading may reflect persistent selling pressure.
Buying just because RSI touched 30 can mean trying to catch a falling knife.
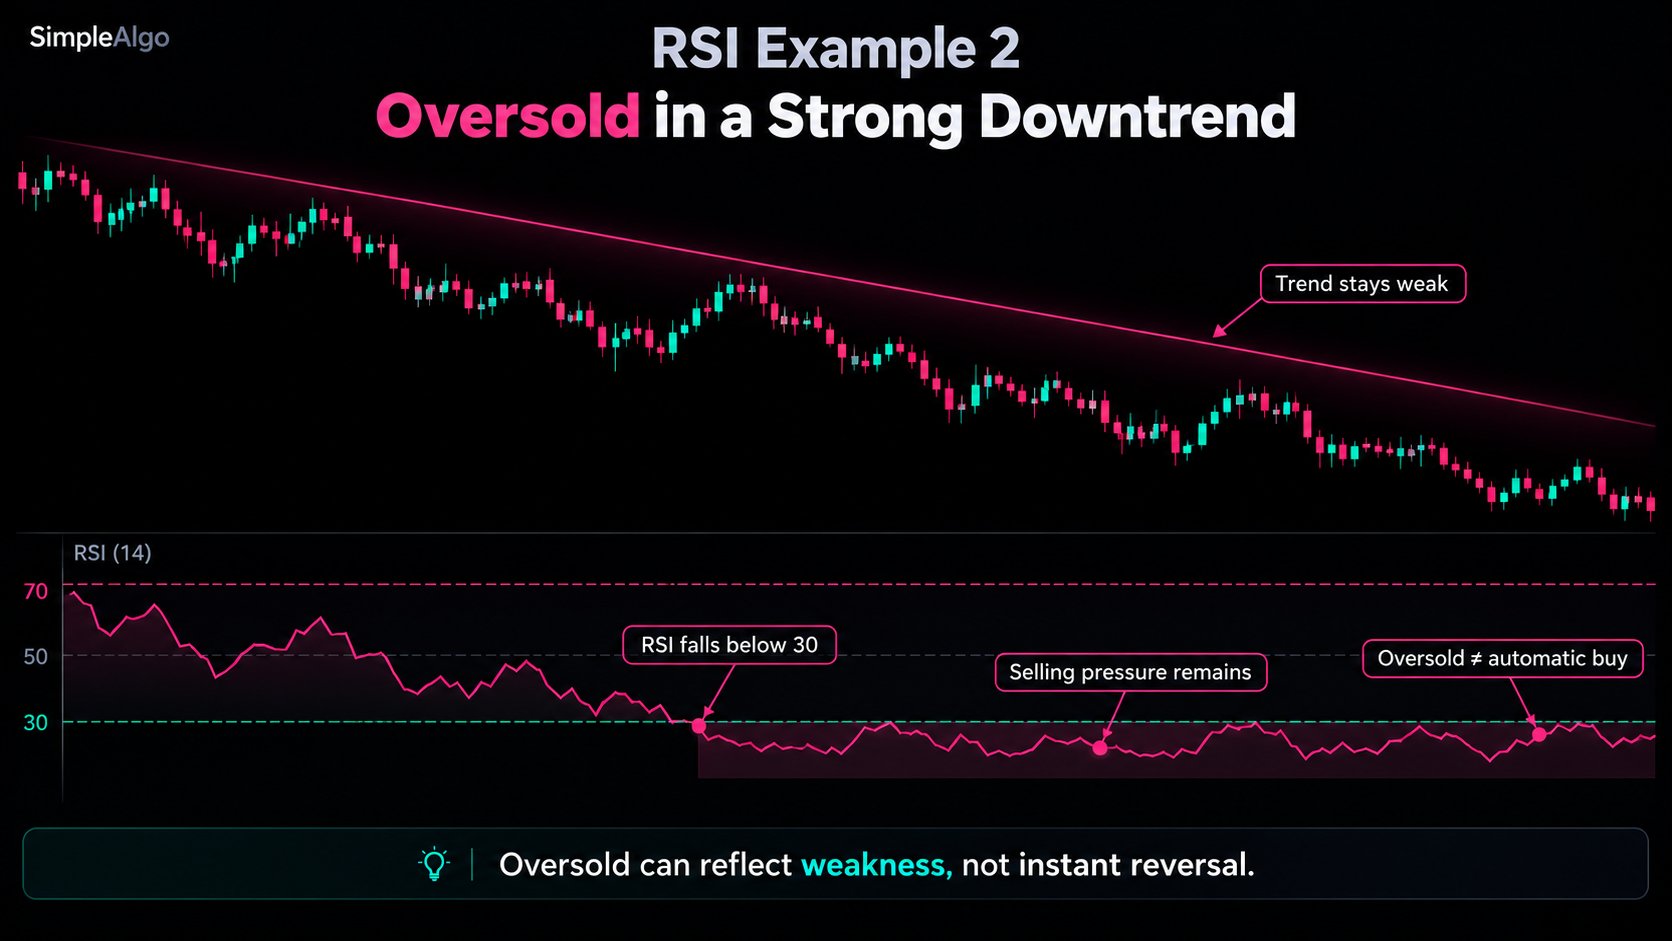
An RSI reading below 30 doesn't guarantee a bounce. Strong selling pressure can keep RSI oversold while price continues making lower lows.
In a sideways market:
Overbought and oversold readings can become more useful for identifying potential reversals near established support and resistance.
That's why context matters so much.
RSI isn't supposed to replace price action.
It's supposed to help you interpret it.
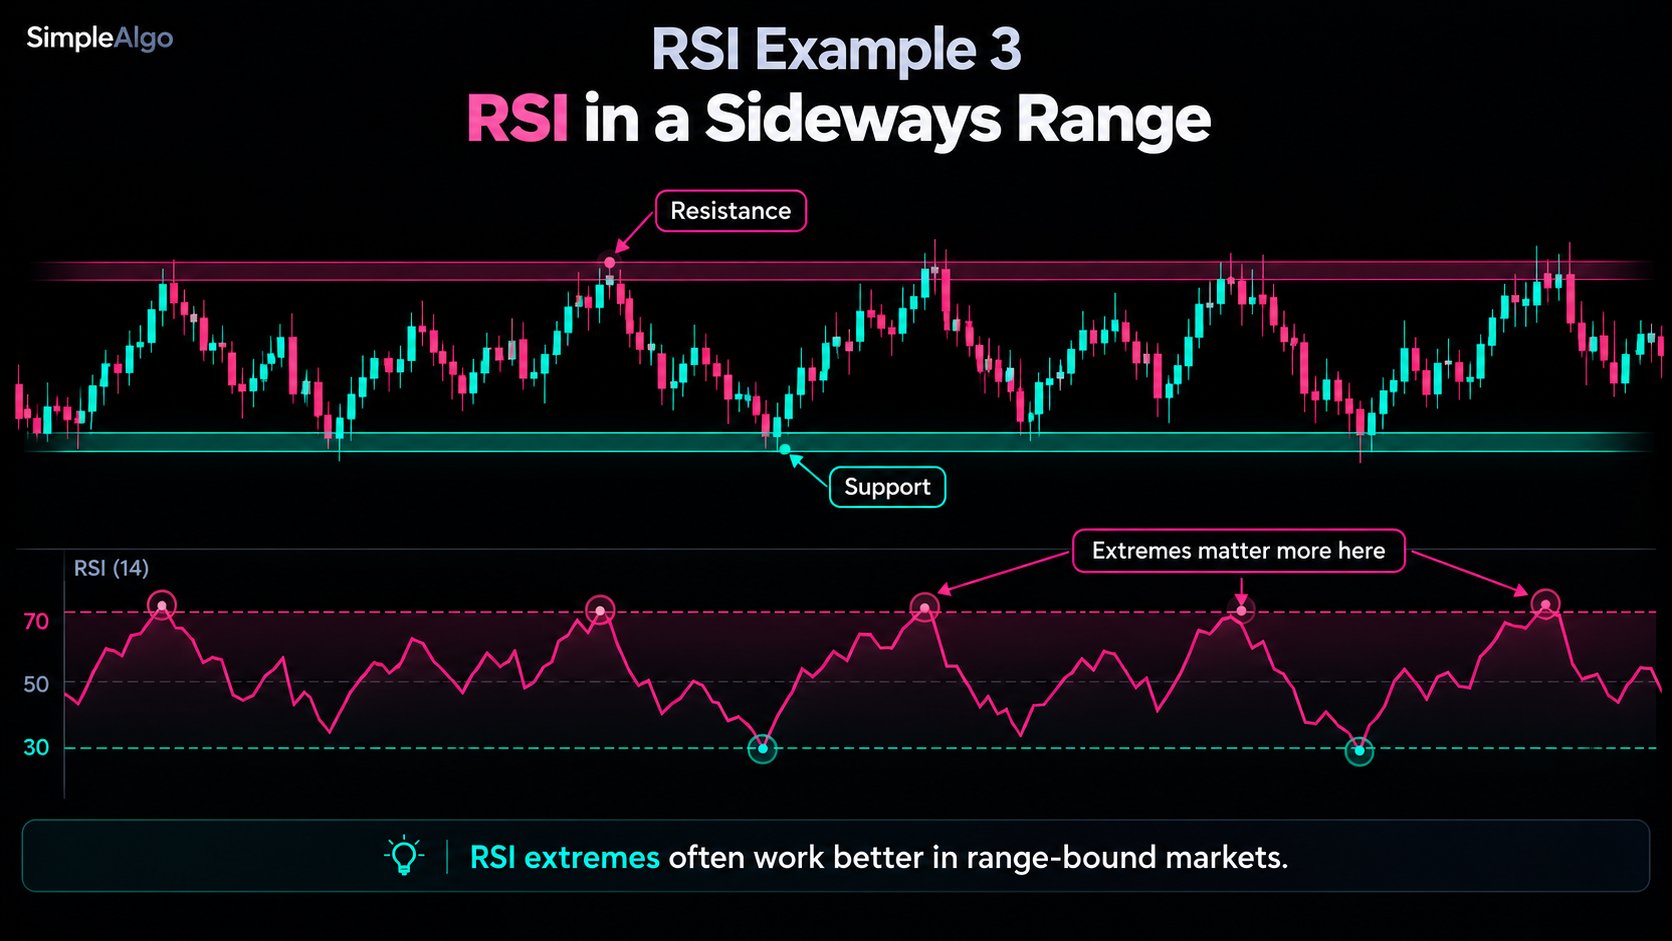
RSI extremes can become more useful in ranging markets. Overbought readings near resistance and oversold readings near support provide additional context for potential reversals.
Stop Looking Only at the RSI Number
This is something most RSI tutorials completely overlook.
Let's say you're watching a chart and RSI reads 63.
You know overbought begins at 70.
But what does that actually mean for price?
How far does the market need to move before RSI reaches 70?
Is price one strong candle away?
Or does it have considerably more room?
A conventional RSI pane doesn't directly answer that question.
And it's an important one.
For example, if you're considering a long trade, understanding how close price is to an overbought threshold can help you evaluate whether momentum is already stretched.
It doesn't determine whether the trade will succeed, but it adds context.
Here's the interesting part:
Because RSI is calculated using changes in price, you can also work backward.
You can calculate what the next closing price would need to be for RSI to reach a specific value.
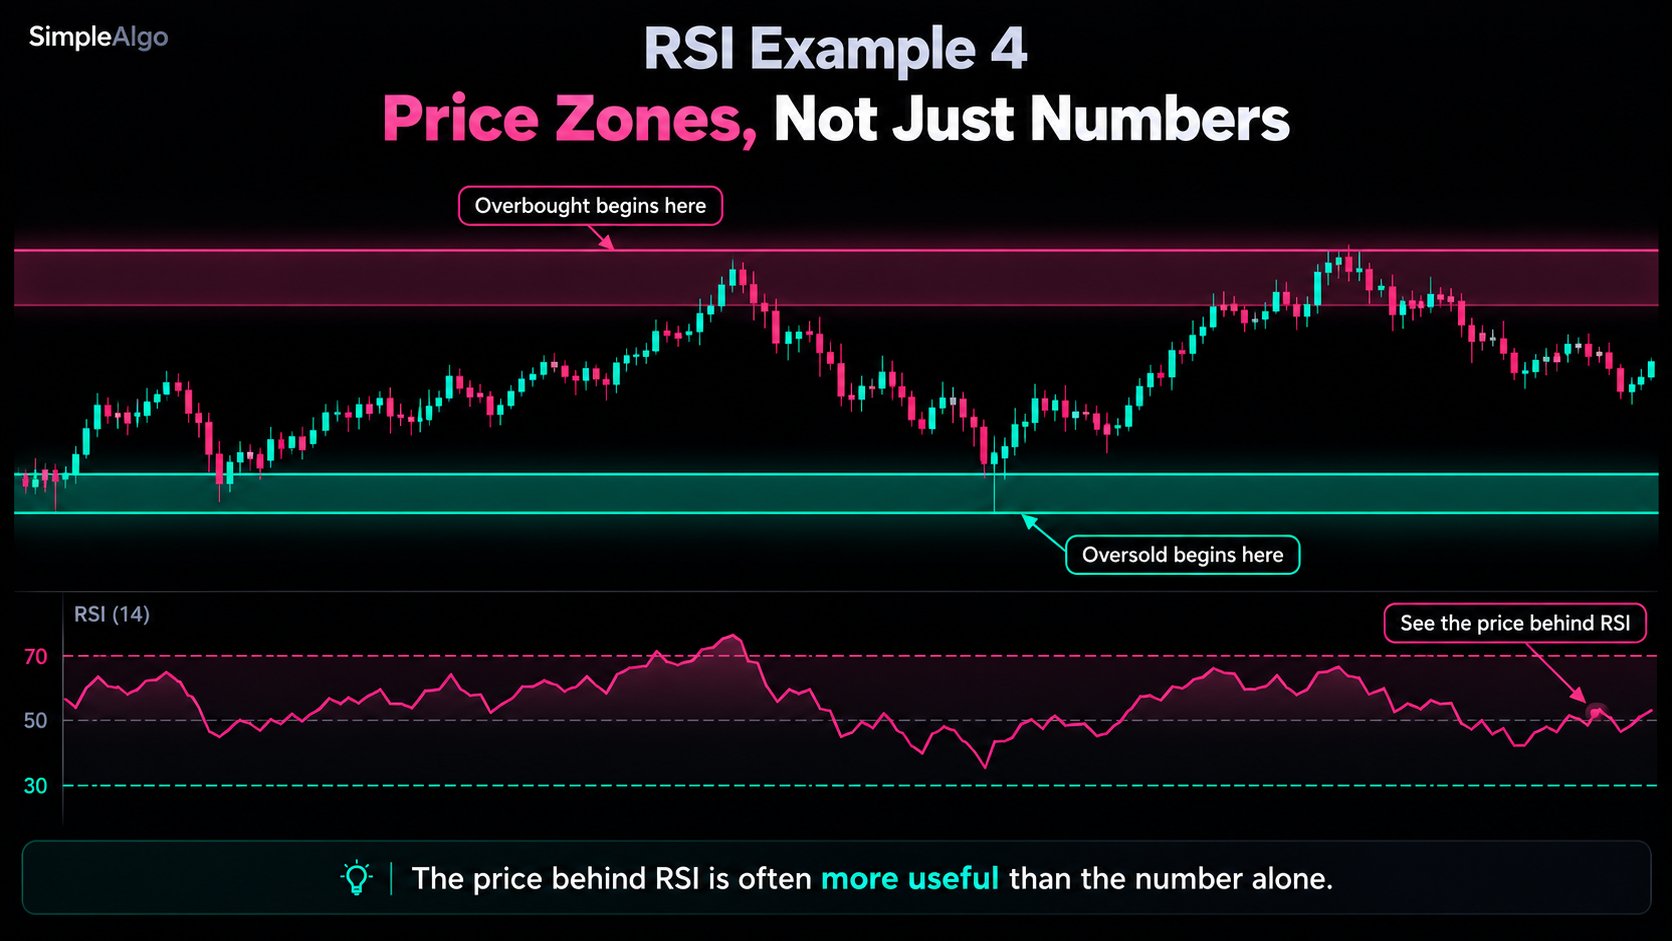
That means the familiar RSI levels of 70 and 30 can be translated into actual prices on the chart.
Instead of just knowing RSI is at 63, you can see the price threshold that would push it into overbought territory on the next bar.
It's a different way to interpret the same indicator.
Pay Attention to How RSI Leaves an Extreme
Entering overbought or oversold territory tells you momentum has become stretched.
But what happens afterward can be just as interesting.
Consider an uptrend where RSI has been above 70 for several candles.
Eventually, RSI falls back below 70.
That tells you upward momentum is no longer meeting the overbought threshold.
It doesn't automatically mean the trend is reversing.
Price could consolidate, pull back slightly, or continue higher after a pause.
But it's useful information, especially if you're already watching resistance, market structure, or weakening price momentum.
The key is understanding the difference between momentum cooling off and a confirmed trend reversal.
They're not the same thing.
And an RSI crossing by itself doesn't establish either trade's risk/reward.
Here's a Simple RSI Framework to Test
Before placing a trade using RSI, walk through these questions.
First: What's the trend?
Are you trading with the broader market direction or trying to catch a reversal?
Second: Where is price?
Look for meaningful support, resistance, previous highs and lows, or established trading ranges.
Third: What is RSI telling you?
Is momentum strengthening, weakening, or already stretched?
Fourth: How is RSI behaving near an extreme?
Did it just enter overbought? Has it remained there for several candles? Has it recently moved back below the threshold?
Finally: Where is your trade invalidated?
A technically interesting setup is worthless without a defined risk plan.
You don't need RSI to agree with every other indicator on your chart.
You need to understand what unique information it's contributing.
And you should test the process across different market conditions before relying on it.
We Built a Free Indicator Around This Idea
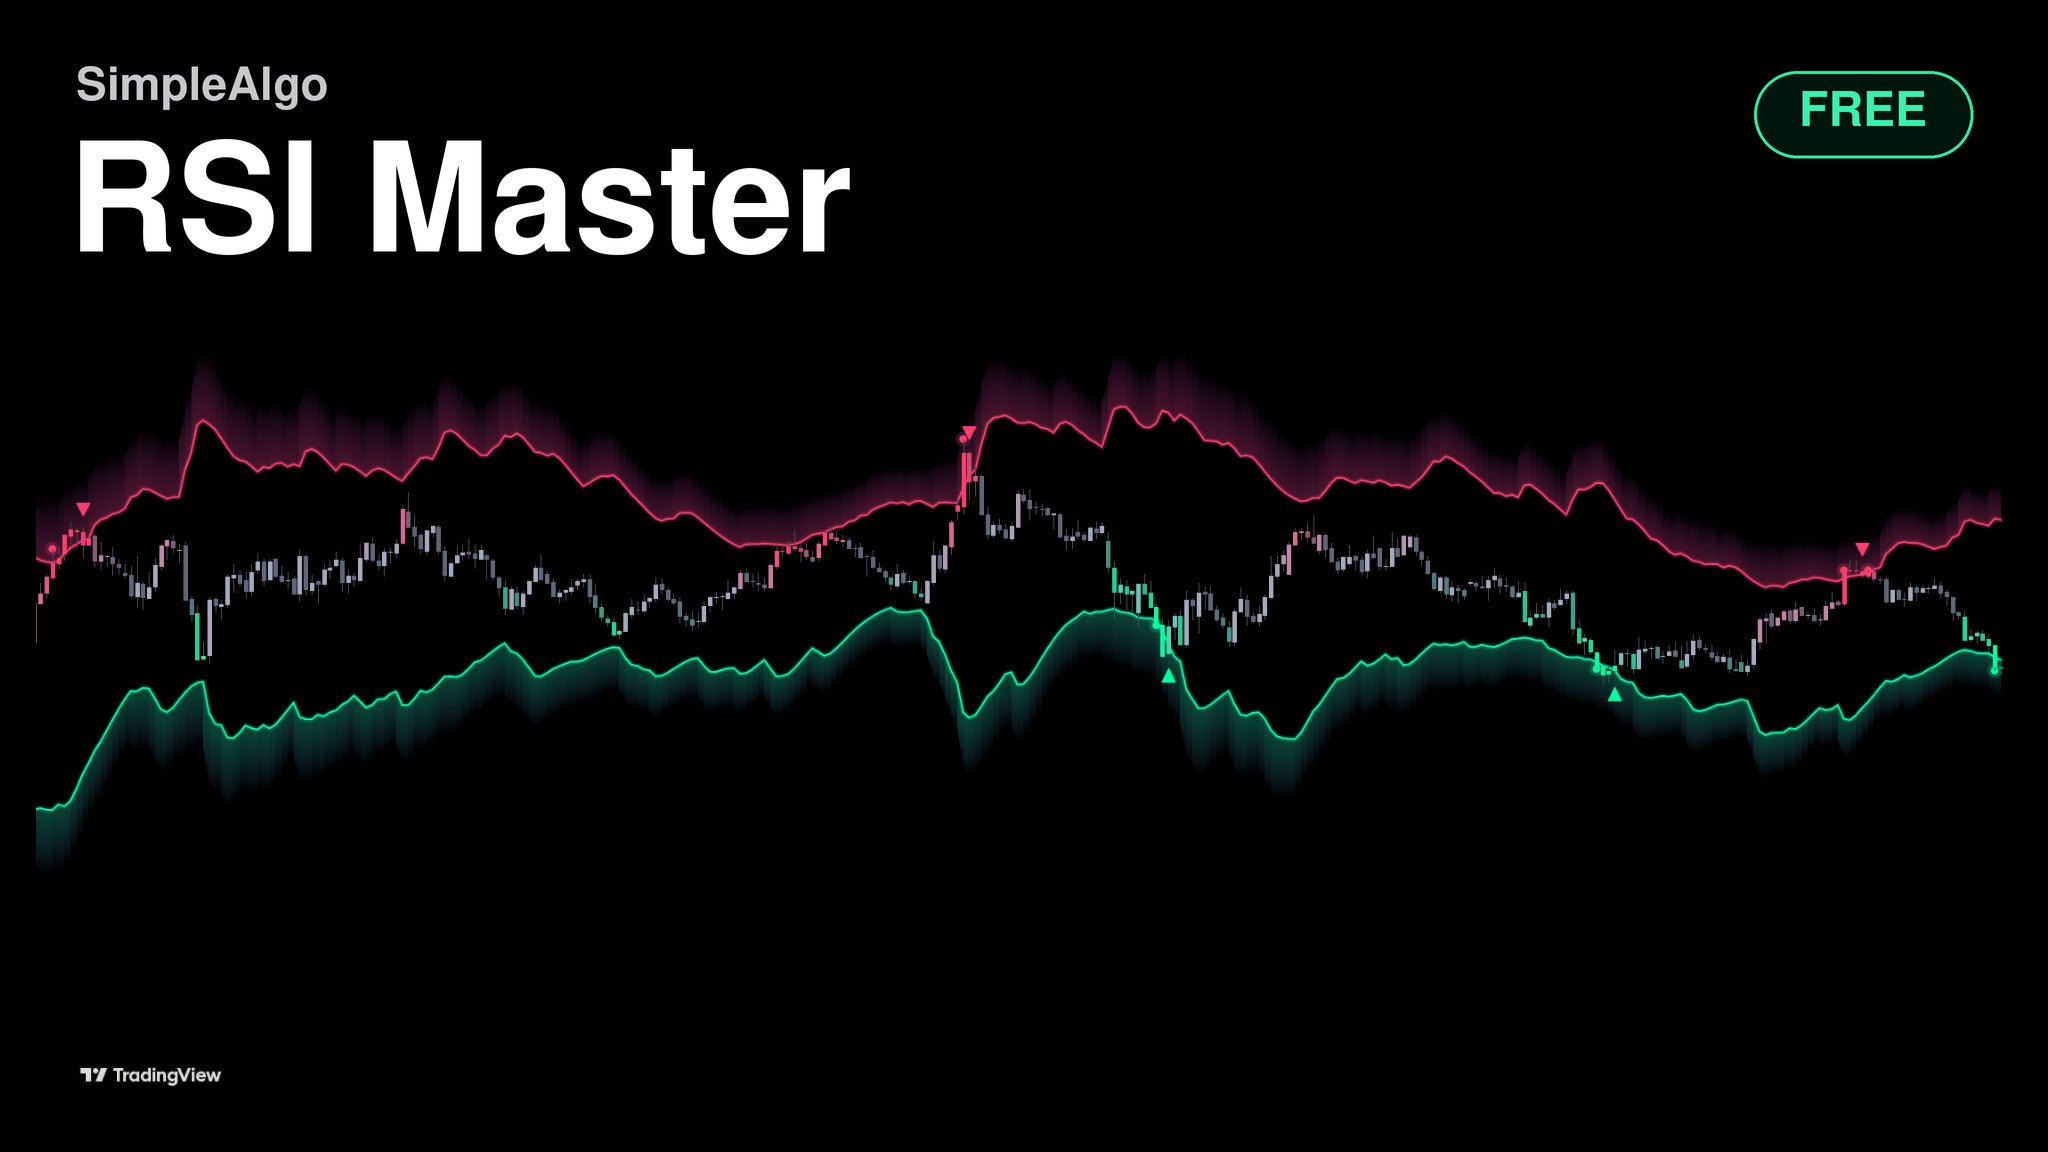
We recently released RSI Master, a free, open-source TradingView indicator built around a simple question:
What if RSI showed you the price instead of just a number?
It uses the standard Wilder RSI calculation, but solves the formula backward to calculate the next-bar closing prices associated with your overbought and oversold thresholds.
Those levels appear directly on the price chart.
A pink zone shows where overbought begins.
A mint zone shows where oversold begins.
The indicator also displays how far price is from each zone in ATRs, marks the first confirmed entry into a zone, and identifies when price leaves one.
There's also a small panel showing what happened after recent overbought and oversold visits on that particular chart.
It's historical context, not a prediction.
And the zones aren't fixed support or resistance levels. They update as market conditions change. The current bar can change until it closes.
We built it because we think technical indicators should make market information easier to interpret, not more complicated.
RSI Master is completely free and open source. No SimpleAlgo subscription required.
You can find it here:
https://simplealgo.io/indicators/rsi-master
The Bottom Line
RSI is much more useful when you stop treating it like a buy and sell button.
Above 70 doesn't automatically mean short.
Below 30 doesn't automatically mean long.
A strong trend can stay stretched. A weak market can keep falling. And no single oscillator can tell you what price will do next.
Instead, use RSI to understand momentum, evaluate how stretched a move has become, and add context to the price action you're already watching.
Don't trade the RSI number. Understand what the number is telling you.
Educational content only. Trading involves risk, and no indicator guarantees profitable results.
Originally published on X. For every setting and alert, see the RSI Master documentation.

Written by
Nikolas MetreveliFounder of SimpleAlgo
Nikolas wrote his first real code at 12 and freelanced software tools and websites for small businesses before finding the markets at 15. He builds and maintains every SimpleAlgo indicator and writes these guides from hands-on use of the tools.
More about Nikolas and SimpleAlgoRelated Articles
Introducing RSI Master: A Free RSI Indicator That Shows the Price
RSI Master is a new free, open-source TradingView indicator. It draws the exact prices where overbought and oversold begin, right on your chart.

How to Add an Indicator on TradingView (Step by Step)
The exact steps to add any indicator to your TradingView chart — built-in, community, and invite-only scripts — on desktop and mobile.

How to Test a Trading Indicator Properly (A Method You Can Run This Week)
A structured way to evaluate any indicator before risking money: define the rules first, use bar replay, log a fixed sample, then check whether your results survive costs.
Related tools and guides
Next steps on this topic from the rest of the SimpleAlgo library.