Why Most Trading Indicators Fail (And What Separates the Ones That Don't)
Lag, curve-fitting, correlated confluence and survivorship bias. Four structural reasons an indicator can look brilliant on a chart and do nothing for your account.

Most indicators don't fail because the maths is wrong. They fail because of how they were built, how they were shown to you, and how you were always going to use them.
Four failure modes cover nearly all of it.
1. Lag is not a bug you can settle
Every indicator derived from price is a transformation of data that has already happened. A 20-period moving average cannot tell you anything until 20 periods have traded. An oscillator cannot register momentum until momentum exists.
The usual reaction is to shorten the lookback — faster settings, earlier signals. That doesn't remove the lag; it lowers the threshold at which noise qualifies as signal. You trade fewer late entries for more false ones.
There is no setting that escapes this. There is only a decision about which error you'd rather make, and the decision should follow your holding period:
An indicator that doesn't acknowledge this trade-off — that markets itself as "no lag" — is either shifting plots backwards in time or firing on the unclosed candle. Both are covered in the repainting guide.
2. Curve-fitting: the settings were chosen after the fact
Give anyone a chart and enough parameters and they will find a combination that looks extraordinary on that chart. Length 14 didn't work, so try 17. Try 21 with a 3-bar smoothing and only in the London session. Eventually the historical picture is beautiful.
What has been discovered is the noise in one specific slice of history, not a property of the market. Forward data has different noise, and the fit dissolves.
Tells that a tool is fitted rather than designed:
The defensible alternative is simple, conventional inputs that scale with volatility rather than being hand-picked per chart, and an explanation of why each one is there.
3. Correlated confluence — five indicators, one opinion
Stacking indicators feels like building a case. Usually it's asking one question five times.
RSI, Stochastic, MACD, CCI and Momentum are all transformations of recent closing prices. When they agree, that is not five independent confirmations — it is one measurement expressed five ways, and the agreement is close to guaranteed. Meanwhile the screen has become unreadable and every entry now requires five conditions, so the ones that pass are the ones already well underway.
Real confluence combines genuinely different information:
Four inputs from four categories tell you more than fifteen oscillators. If you can't name which category each indicator on your chart belongs to, you have duplicates.
4. Survivorship bias in everything you were shown
You see the screenshots that worked. You do not see the same indicator over the flat month, the false-break week, or the market it was never tested on. Nobody posts those, and there's no conspiracy required — people post their best charts.
This is why a gallery of winning trades carries so little information, and why we don't publish one. A fair picture requires the losing sequences at the same size, on the same markets, with the same settings, and almost nobody shows that.
The only version you can trust is the one you generate yourself, on your market, over a window you chose before you looked.
What the ones that survive have in common
The uncomfortable part
Even an indicator that passes all six will not rescue an account that risks too much per trade. Position sizing determines survival; the indicator determines only what you look at. That's why every tool page on this site links to the position size calculator and the risk of ruin calculator rather than to a results page.
If you want to judge any tool — ours included — run the verification method rather than reading another review.
We publish no win rates, no return figures and no backtest statistics — for our own tools or anyone else's — because no vendor can prove those numbers to you and you should not trade on a number you cannot verify. Everything above is educational. Trading carries a substantial risk of loss. SimpleAlgo is not affiliated with, endorsed by, or sponsored by TradingView. TradingView is a trademark of TradingView, Inc.
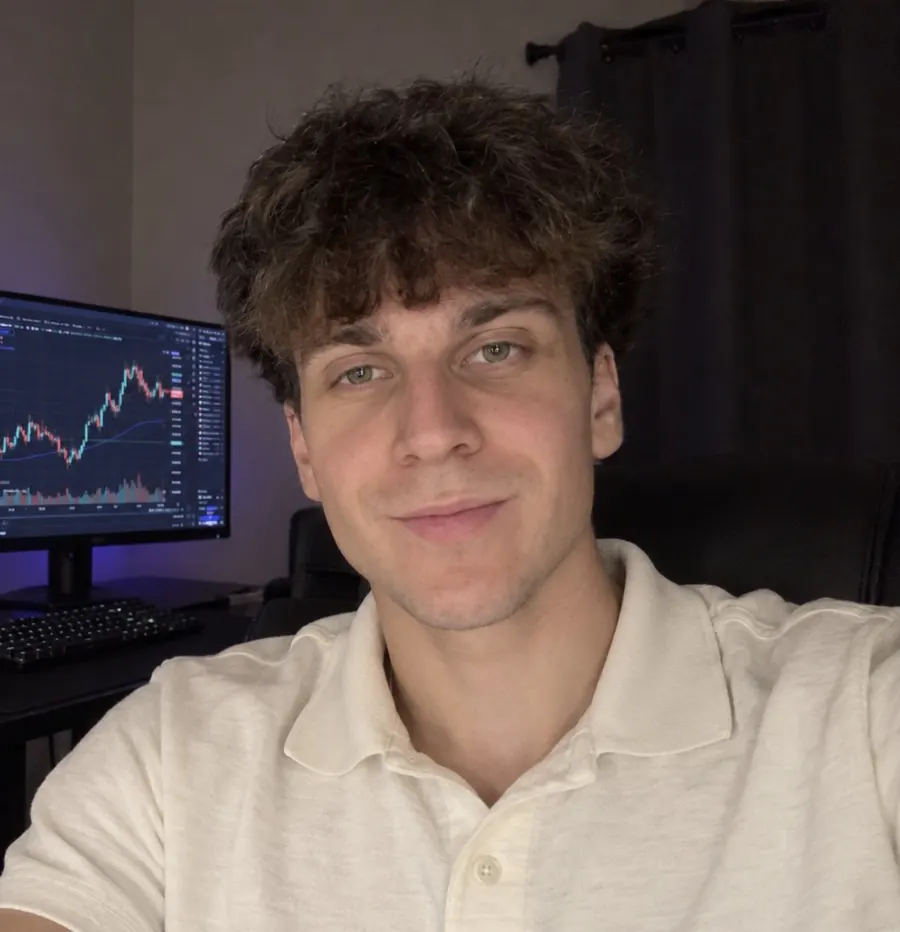
Written by
Nikolas MetreveliFounder of SimpleAlgo
Nikolas wrote his first real code at 12 and freelanced software tools and websites for small businesses before finding the markets at 15. He builds and maintains every SimpleAlgo indicator and writes these guides from hands-on use of the tools.
More about Nikolas and SimpleAlgoRelated Articles

Do TradingView Indicators Repaint? How to Check in Five Minutes
Repainting is the single reason a chart full of perfect arrows produces nothing in live trading. Here is what actually causes it, and a test you can run on any script before you trust it.

How to Test a Trading Indicator Properly (A Method You Can Run This Week)
A structured way to evaluate any indicator before risking money: define the rules first, use bar replay, log a fixed sample, then check whether your results survive costs.

How SimpleAlgo Signals Actually Work (No Black Box)
What the indicator measures, when a signal is finalised, how stops and targets are derived, and the specific situations where it performs badly.
Related tools and guides
Next steps on this topic from the rest of the SimpleAlgo library.