TradingView Price Different From Your Broker? Here's Why
Your chart says 1.0842 and your platform says 1.0839. Nothing is broken — different feeds, different sessions, different quotes.

Two charts of the "same" market rarely match exactly, and the differences are structural rather than errors. Knowing which one applies matters, because some are harmless and one will wreck a backtest.
1. Different data sources
The symbol on your chart comes from a specific exchange, broker or aggregated feed. Your execution platform quotes its own liquidity. In decentralised markets like spot forex and crypto there is no single official price, so two feeds legitimately differ by small amounts all day.
Check the exchange name next to the symbol. Where your broker's feed is available on the platform, selecting it removes most of the discrepancy.
2. Bid vs ask vs last
Charts typically plot the last traded price or the bid. Your platform may quote the ask when you buy. The gap between them is the spread, and it is not an error — it's the cost of crossing.
This alone explains most small differences in forex and crypto.
3. Delayed data
Without a real-time subscription for that exchange, your chart shows delayed data. In fast conditions a delayed chart and a live platform will disagree substantially. The delay status appears near the symbol.
4. Session settings
Extended-hours trading, different session open and close times, and different timezone settings all change what a candle contains. A daily candle built from 24-hour data is a different candle from one built from a regular session, even from the same feed.
Check chart settings → Symbol → session, and confirm the timezone at the bottom right of the chart.
5. Contract rollover in futures
Continuous futures symbols stitch contracts together, and the method used to join them changes historical prices. Your broker showing a specific contract month will not match a continuous chart in the history, even though the current price agrees.
6. Aggregated or index symbols
Some symbols are indices or averages across venues rather than a tradable instrument. They're useful for analysis and will never match a single broker's quote exactly.
Which differences matter
Harmless: a few ticks of bid/ask difference, tiny feed variance between venues on the same instrument.
Worth fixing: a delayed feed while trading live, a session or timezone mismatch, backtesting on a continuous contract and trading a single month.
Serious: building a strategy on one feed and executing on another where the difference exceeds your average profit per trade. Scalping strategies in particular can be entirely wiped out by a spread difference, which is one more reason to include realistic costs when you backtest.
How to reduce the gap
Small differences are a permanent feature of fragmented markets. The goal is to know the size of yours, not to make it zero.
Frequently Asked Questions
Why is the price on TradingView different from my broker?
Different data feeds. TradingView may show prices from one exchange or provider, while your broker quotes its own feed, which can include its own spread.
How do I make TradingView match my broker?
Search for the symbol and pick the version listed under your broker or the same exchange your broker uses. The small differences that remain come from spread and feed timing.
SimpleAlgo is not affiliated with, endorsed by, or sponsored by TradingView. TradingView is a trademark of TradingView, Inc. Platform menus and settings change over time — if a step doesn't match what you see, check TradingView's current help documentation.
Filed under
Written by
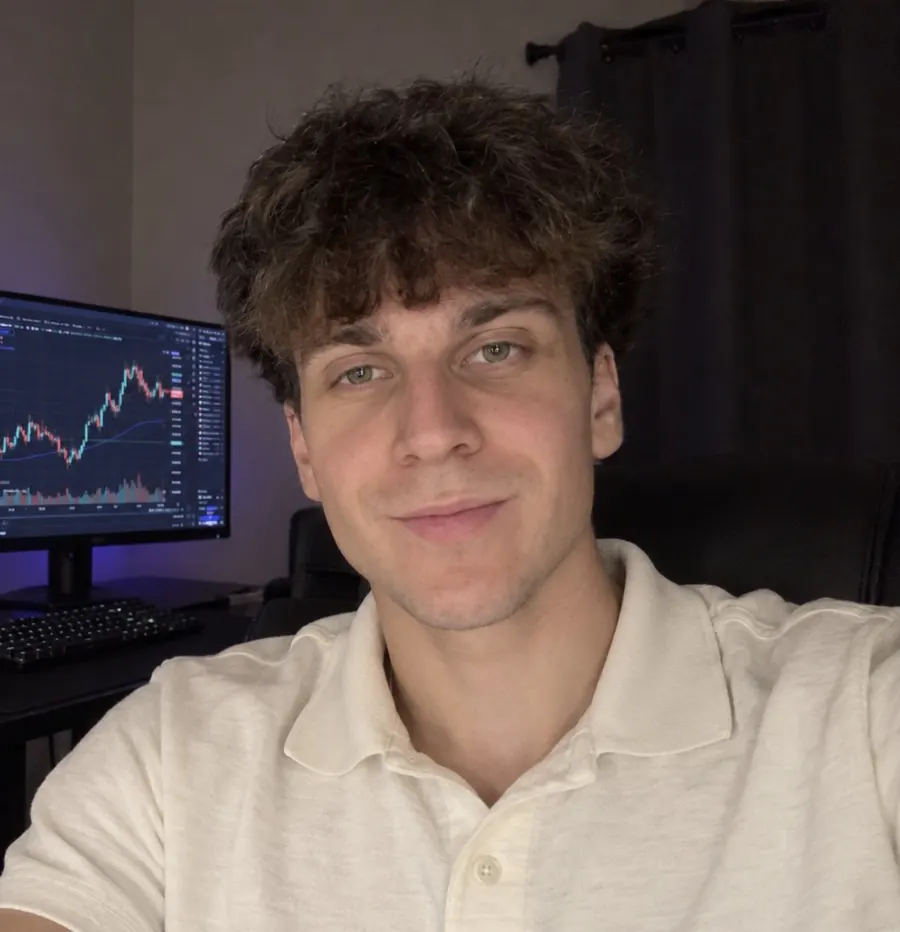
Nikolas MetreveliFounder of SimpleAlgo
Nikolas wrote his first real code at 12 and freelanced software tools and websites for small businesses before finding the markets at 15. He builds and maintains every SimpleAlgo indicator and writes these guides from hands-on use of the tools.
More about Nikolas and SimpleAlgoRelated Articles

Repainting Indicators on TradingView: How to Spot Them
Repainting is why a script with a flawless chart history loses money live. Here's what causes it, the three kinds you'll meet, and a 10-minute test that exposes any of them.

How to Backtest a Strategy on TradingView
Use the Strategy Tester properly — commissions, slippage, sample size and the settings that turn an impressive backtest into an honest one.

How to Add an Indicator on TradingView (Step by Step)
The exact steps to add any indicator to your TradingView chart — built-in, community, and invite-only scripts — on desktop and mobile.
Related tools and guides
Next steps on this topic from the rest of the SimpleAlgo library.